Showing posts with label Climate Change - The Current Cooling Trend. Show all posts

Thursday, April 12, 2012

Warmists Hype One Warm Quarter Over 2% of the Planet

Click here and note that CNN reports:
“March 2012 will go down as the warmest March in the United States since record-keeping began in 1895, NOAA said Monday.

In addition, the three-month period of January, February and March was the warmest first quarter ever recorded in the Lower 48 states.”
Let’s put that into proper context:

1) Peer reviewed science finds a 30% warming bias in the NOAA NCDC data. This calls into question whether any records were really set.

2) If we arbitrarily select the last 120 months (exactly 10 years) of RSS satellite data, we find:

A) Ten years of significant global cooling.

B) Both March and the first quarter of 2012 are substantially BELOW the 10 year trend line.

Click the image to enlarge it:
Click the image to enlarge it
Click here to view the source.
Click here to view the raw data.

Click here for some basic climate change science.
Click here to debunk the hysteria topic by topic.

Sunday, April 1, 2012

Over 15 Years of Global Cooling!

RSS MSU data show over 15 years of global cooling.
(Least squares trend line; slope = -0.000835651 per year)
Note, globally, the particularly COLD winter of 2012.

Click the image to enlarge it: Click the image to enlarge it
Click here for the source.
Click here for the raw data.

By NOAA’s own standards, this cooling trend in excess of 15 years means (with a 95% degree of confidence) all IPCC computer models (the sole source of ALL the climate change hysteria mongering) are FURTHER invalidated and rendered USELESS!

Click here for more on the current cooling trend.

Click here for some basic climate change science.
Click here to debunk the hysteria topic by topic.

Wednesday, January 11, 2012

80 Year USA Cooling Trend for December

1) This post deals with USA temperatures.
2) Click here to address global temperature trends.
3) Click here to reproduce each NOAA graph below.
4) Note the warming bias (about 30%) in NOAA data.


80 Year USA Cooling Trend for December.
Click the image to enlarge it:

Click the image to enlarge it

Please! Tell me again who thinks it is a good idea to utterly waste $45 TRILLION in order to pretend we can micromanage climate change. Kyoto has already PROVEN that we can waste all the money we want and we will not even come CLOSE to changing the global temperature in any way which could even be measured.

Furthermore, history tells us that the estimate of $45 TRILLION would balloon into at LEAST a full order of magnitude above that figure.

Click here for some basic climate change science.
Click here to debunk the hysteria topic by topic.

Sunday, December 4, 2011

Catastrophic Warming -- PANIC NOW!

1/3/2012 Update:
Click here to see year end results.

In May of 2002, NASA launched the AQUA satellite. The AMSU instrument, onboard the AQUA satellite, began collecting global temperature data in July of 2002. The chart below demonstrates the catastrophic amount of warming witnessed in the nine years this instrument has been collecting data.

Oh, wait…
The current global temperature is actually lower than it was when the satellite began collecting data.

Well…
Pay no attention to THAT minor detail! We know that CO2 is causing catastrophic warming (our computer models tell us so).

And…
We know that we MUST dole out $45 TRILLION dollars to hideously corrupt crony capitalists in order to save the planet.

So…
Science be damned! Get on board or DIE! NOW!

Yeah, maybe not…
Maybe the climate charlatans have cynically exploited the latest warming phase of the Atlantic Multi-decadal Oscillation in order the line their own pockets.

Click the image to enlarge it:
Click the image to enlarge it
Click here to reproduce the above chart.
Click here for some basic climate change science.
Click here to debunk the hysteria topic by topic.

Thursday, November 3, 2011

In October, Global Temps in Free Fall

In this post, I further substantiate my assertion that the (perfectly natural) Atlantic Multidecadal Oscillation has been the primary driver of global climate change over the last century.

Quoting Dr. Roy Spencer:
“The Northern Hemisphere, Southern Hemisphere, and tropics have all cooled substantially, consistent with the onset of another La Nina, with the tropics now back below the 1981-2010 average…

the temperature free-fall continues so I predict November will see another substantial drop in global temperatures…

taking a line from our IPCC brethren… While any single month’s drop in global temperatures cannot be blamed on climate change, it is still the kind of behavior we expect to see more often in a cooling world.”
Click the image & read the rest:
Click the image & read the rest
Click here to enlarge the image.

Quoting Dr. Roy Spencer again
(describing the black line on the chart below):
“The 3rd order polynomial fit to the data (courtesy of Excel) is for entertainment purposes only, and should not be construed as having any predictive value whatsoever.”
Click the image & read the rest:

Click here to enlarge the image.

Now, in that last image, the black line may not (in Dr. Spencer’s view) hold any predictive value. But, it is a perfect fit with the AMO index for that period. Owing to the means whereby it is calculated, the black line lags the AMO index by pretty much exactly 10 years. In other words, the AMO index bottomed out in 1976 and peaked in 1998. The black line bottomed out in 1986 and peaked in 2008.

Click here and examine my assessment of how the AMO killed the CAGW cult.

Click here and examine how the newly released BEST data demonstrate that the AMO has been the primary driver of climate change over the last century.

If the AMO index remains consistent, why would we not expect global temperatures to continue to reflect the pattern of the AMO index? That would suggest a continued flat trend (in general) through about 2018 followed by about 30 years of substantial cooling.

Friday, July 8, 2011

June 2011 Update - Current USA Cooling Trend

1) This post deals with USA temperatures.
2) Click here to address global temperature trends.
3) Click here to reproduce each NOAA graph below.
4) Note the warming bias (about 30%) in NOAA data.


25 Year USA Trend for June.
A warming of 0.06F per decade?
OMG! Is it time to panic yet?
With the 30% warming bias, this is actually a cooling trend.
Click the image to enlarge it:

Click the image to enlarge it


25 Year YTD USA Cooling Trend.
Click the image to enlarge it:

Click the image to enlarge it


Please! Tell me again who thinks it is a good idea to utterly waste $76 TRILLION in order to pretend we can micromanage climate change. Kyoto has already PROVEN that we can waste all the money we want and we will not even come CLOSE to changing the global temperature in any way which could even be measured.

Furthermore, history tells us that the estimate of $76 TRILLION would balloon into at LEAST a full order of magnitude above that figure.

Click here for some basic climate change science.
Click here to debunk the hysteria topic by topic.

Saturday, June 11, 2011

May 2011 Update - Current USA Cooling Trend

1) This post deals with USA temperatures.
2) Click here to address global temperature trends.
3) Click here to reproduce each NOAA graph below.
4) Note the warming bias (about 30%) in NOAA data.
5) May 2011 - COLDER than the average 20th century May!
6) YTD 2011 - COLDER than the average 20th century YTD!


25 Year USA Cooling Trend for May.
Click the image to enlarge it:

Click the image to enlarge it


25 Year YTD Cooling Trend.
Click the image to enlarge it:

Click the image to enlarge it


Please! Tell me again who thinks it is a good idea to utterly waste $45 TRILLION in order to pretend we can micromanage climate change. Kyoto has already PROVEN that we can waste all the money we want and we will not even come CLOSE to changing the global temperature in any way which could even be measured.

Furthermore, history tells us that the estimate of $45 TRILLION would balloon into at LEAST a full order of magnitude above that figure.

Click here for some basic climate change science.
Click here to debunk the hysteria topic by topic.

Monday, May 9, 2011

April 2011 Update - Current USA Cooling Trend

1) This post deals with USA temperatures.
2) Click here to address global temperature trends.
3) Click here to reproduce each NOAA graph below.
4) Note the warming bias (about 30%) in NOAA data.


26 Year USA Cooling Trend for April.
Click the image to enlarge it:


26 Year YTD Cooling Trend.
Click the image to enlarge it:


Please! Tell me again who thinks it is a good idea to utterly waste $45 TRILLION in order to pretend we can micromanage climate change. Kyoto has already PROVEN that we can waste all the money we want and we will not even come CLOSE to changing the global temperature in any way which could even be measured.

Furthermore, history tells us that the estimate of $45 TRILLION would balloon into at LEAST a full order of magnitude above that figure.

Click here for some basic climate change science.
Click here to debunk the hysteria topic by topic.

Saturday, April 9, 2011

March Update - Current USA Cooling Trend

1) This post deals with USA temperatures.
2) Click here to address global temperature trends.
3) Click here to reproduce each NOAA graph below.
4) Note the warming bias (about 30%) in NOAA data.


25 Year USA Cooling Trend for March.
Click the image to enlarge it:


25 Year YTD Cooling Trend.
2011 YTD is BELOW the 20th century average!
Click the image to enlarge it:


Please! Tell me again who thinks it is a good idea to utterly waste $45 TRILLION in order to pretend we can micromanage climate change. Kyoto has already PROVEN that we can waste all the money we want and we will not even come CLOSE to changing the global temperature in any way which could even be measured.

Furthermore, history tells us that the estimate of $45 TRILLION would balloon into at LEAST a full order of magnitude above that figure.

Click here for some basic climate change science.
Click here to debunk the hysteria topic by topic.

Tuesday, April 5, 2011

Largest March Snow Cover Since 1987

Quoting Steven Goddard at Real Science
(I inserted the second link):
“Extensive northern hemisphere snow cover during the 1970s was caused by record cold and global cooling, but now it is caused by record heat and global warming. Like when your broiler starts behaving like the deep freeze.

http://climate.rutgers.edu/snowcover/table_area.php?ui_set=1&ui_sort=0

So far this year, snow cover has been fifth highest on record. Snow cover has been rising steadily for 20 years, in direct proportion to the level of dishonesty from the global warming funded alarmist community.”
Click the image & read the rest:
Click the image & read the rest
“Inconvenient” for the KeepWinterCool charlatans.
Click here to further inconvenience these scammers.

Click here for some basic climate change science.
Click here to debunk the hysteria topic by topic.

Tuesday, March 8, 2011

February Update - Current USA Cooling Trend

1) This post deals with USA temperatures.
2) Click here to address global temperature trends.
3) Click here to reproduce each NOAA graph below.
4) Note the warming bias (about 30%) in NOAA data.


30 Year USA Cooling Trend for February.
12 of the last 30 years were BELOW 20th century avg.
Click the image to enlarge it:


20 Year Dramatic USA Cooling Trend for February.
8 of the last 20 years were BELOW 20th century avg.
Click the image to enlarge it:


24 Year Winter COOLING Trend!
Click the image to enlarge it:


13 Winters of RAPID COOLING!
Click the image to enlarge it:


12 Years of Annualized RAPID COOLING!
Click the image to enlarge it:

Click the image to enlarge it


Please! Tell me again who thinks it is a good idea to utterly waste $45 TRILLION in order to pretend we can micromanage climate change. Kyoto has already PROVEN that we can waste all the money we want and we will not even come CLOSE to changing the global temperature in any way which could even be measured.

Furthermore, history tells us that the estimate of $45 TRILLION would balloon into at LEAST a full order of magnitude above that figure.

Click here for some basic climate change science.
Click here to debunk the hysteria topic by topic.

Tuesday, February 8, 2011

January Update - Current USA Cooling Trend

1) This post deals with USA temperatures.
2) Click here to examine a 71 year cooling trend.
3) Click here & here for global temperature trends.
4) Click here to reproduce each NOAA graph below.
5) Note the warming bias (about 30%) in NOAA data.


21 Year USA Cooling Trend for January.
Click the image to enlarge it:

Click the image to enlarge it


23 Winters with NO WARMING!
Will this be winter number 24?
Click the image to enlarge it:

Click the image to enlarge it


12 Winters of RAPID COOLING!
Will this be winter number 13?
Click the image to enlarge it:

Click the image to enlarge it


12 Years of Annualized RAPID COOLING!
Will this be year number 13?
Click the image to enlarge it:

Click the image to enlarge it


Please! Tell me again who thinks it is a good idea to utterly waste $45 TRILLION in order to pretend we can micromanage climate change. Kyoto has already PROVEN that we can waste all the money we want and we will not even come CLOSE to changing the global temperature in any way which could even be measured.

Furthermore, history tells us that the estimate of $45 TRILLION would balloon into at LEAST a full order of magnitude above that figure.

Click here for some basic climate change science.
Click here to debunk the hysteria topic by topic.

Thursday, February 3, 2011

January 2011 Shows Global Temps in Freefall

Quoting PhD Climatologist Dr. Roy W. Spencer:
“January 2011 experienced a precipitous drop in lower tropospheric temperatures over the tropics, Northern Hemisphere, and Southern Hemisphere. This was not unexpected, since global average sea surface temperatures have been falling for many months”
Click the image & read the rest:
Click the image & read the rest
Click here to enlarge the image.

The 2010 el Niño induced warming is history.
The fraudulent exploitation of that warming is history.
And, the CAGW religious cult is also history.

What is NOT history is EPA tyranny.

Click here & examine the USA cooling trend.
Click here & expose the fully discredited IPCC.
Click here for some basic climate change science.
Click here to debunk the hysteria topic by topic.

Tuesday, February 1, 2011

Dims warned us about lack of snow

Remember when Global Warming meant no more snow?

Do these tyrannical charlatans just make it up as they go?

Click here & examine the USA cooling trend.
Click here & expose the fully discredited IPCC.
Click here for some basic climate change science.
Click here to debunk the hysteria topic by topic.

Friday, January 14, 2011

Climate charlatans make it up as they go

In 1975, climate charlatans swore we would all freeze to death unless big government came to our rescue.

In 2000, climate charlatans swore we would never see snow again unless big government came to our rescue.

Today, climate charlatans swear we will all be buried in snow unless big government comes to our rescue. They also swear they knew all along that global warming causes global cooling and massive amounts of snow and that all their past predictions are now coming true.

Do you get the feeling these climate charlatans just make it up as they go?

How stupid do they think we are?

Click here to explain the rise & fall of cooling AND warming hysteria.

Click here & expose the fully discredited IPCC.
Click here for some basic climate change science.
Click here to debunk the hysteria topic by topic.

Thursday, January 13, 2011

The Winter of the Alarmist Discontent

Hat Tip to The SPPI Blog.
Click the image to enlarge it:

Click the image to enlarge it

With England in the midst of what could be their coldest winter in 1,000 years, the alarmists at the British Met Office are having a hard time selling their Global Warming alarm. But, that is far from the only place where Gaia seems to be openly mocking the hysteria mongers.

Yes, yes, I know…
It’s only “weather” (unless, of course, it makes for useful propaganda).

So, the alarmists will point to a single hot spell in a single Russian summer as irrefutable evidence of catastrophic man made global warming. But, what will they make of 23 sequential years of USA winters failing to cooperate with their propaganda? The silence is deafening!

Alarmists -- including those at the Met Office -- dishonestly focus attention on the last three decades. They know as well as I do that the AMO (Atlantic Multidecadal Oscillation) has been the primary driver of the last three decades. They also know the AMO has plateaued and that the AMO driven warming is OVER. Additionally, they know -- as this chart from this post documents -- that we need only look back another 5 decades to utterly destroy their purely political propaganda.

It seems as though “climate” -- according to the hysteria mongers -- is anything useful in promoting their purely political propaganda.

Click here for some basic climate change science.
Click here to debunk the hysteria topic by topic.

Thank You, ICECAP!

I am honored to note that the prestigious ICECAP (International Climate and Environmental Change Assessment Project) published my post in their 1/12/2011 entry of their “What’s New and Cool” section.

I encourage my readers to visit ICECAP regularly for information related to climate change.

Thank you, ICECAP!

Wednesday, January 12, 2011

December Update - Current USA Cooling Trend

1) This post deals with USA temperatures.
2) Click here to address global temperature trends.
3) Click here to reproduce each NOAA graph below.
4) Note the warming bias (about 30%) in NOAA data.


71 Year USA Cooling Trend for December.
Click the image to enlarge it:

Click the image to enlarge it


23 Winters with NO WARMING!
Will this be winter number 24?
Click the image to enlarge it:

Click the image to enlarge it


12 Winters of RAPID COOLING!
Will this be winter number 13?
Click the image to enlarge it:

Click the image to enlarge it


12 Years of Annualized RAPID COOLING!
Click the image to enlarge it:

Click the image to enlarge it


Please! Tell me again who thinks it is a good idea to utterly waste $45 TRILLION in order to pretend we can micromanage climate change. Kyoto has already PROVEN that we can waste all the money we want and we will not even come CLOSE to changing the global temperature in any way which could even be measured.

Furthermore, history tells us that the estimate of $45 TRILLION would balloon into at LEAST a full order of magnitude above that figure.

Click here for some basic climate change science.
Click here to debunk the hysteria topic by topic.

Thursday, December 30, 2010

Britain's winter may be coldest in 1,000 years

Quoting The Daily Star:
“Britain’s winter is the coldest since 1683 and close to being the chilliest in nearly 1,000 years.”
Click the image & read the rest:
Click the image & read the rest
But, don’t dare question the climate alarmists!
They might haul you off to jail (or worse).

Click here for some basic climate change science.
Click here to debunk the hysteria topic by topic.

Tuesday, December 28, 2010

23 USA winters have defied the alarmists

With all the media hype over the recent blizzard in the northeast, it is tempting to think that this is the first recent USA winter to defy the climate alarmists. Not true!

The alarmists tell us that Man Made Global Warming is most evident in warmer winters in the northern hemisphere. Is it mere coincidence that perfectly natural Milankovitch Cycles have the same effect? You decide.

If USA winters are any guide, the AGW theory is not holding up very well. The data from the alarmists at NOAA demonstrate a dramatic 12 year winter cooling trend and an absolutely flat trend for the last 23 years.

Furthermore, these reported surface temperature trends have been demonstrated by peer reviewed science to have a warming bias of about 30%!

Click here for some basic climate change science.
Click here to debunk the hysteria topic by topic.

Thursday, November 4, 2010

AP Propaganda Denies Global Cooling

Quoting Seth Borenstein, the infamous AP propagandist
(Note: Seth wrote this about one year ago):
“An analysis of global temperatures by independent statisticians shows the Earth is still warming and not cooling as some global warming skeptics are claiming.”
Where to begin in debunking this nonsense? There are sooo many entry points to choose from, sooo many easy angles of attack. Let’s examine the top three angles of attack:

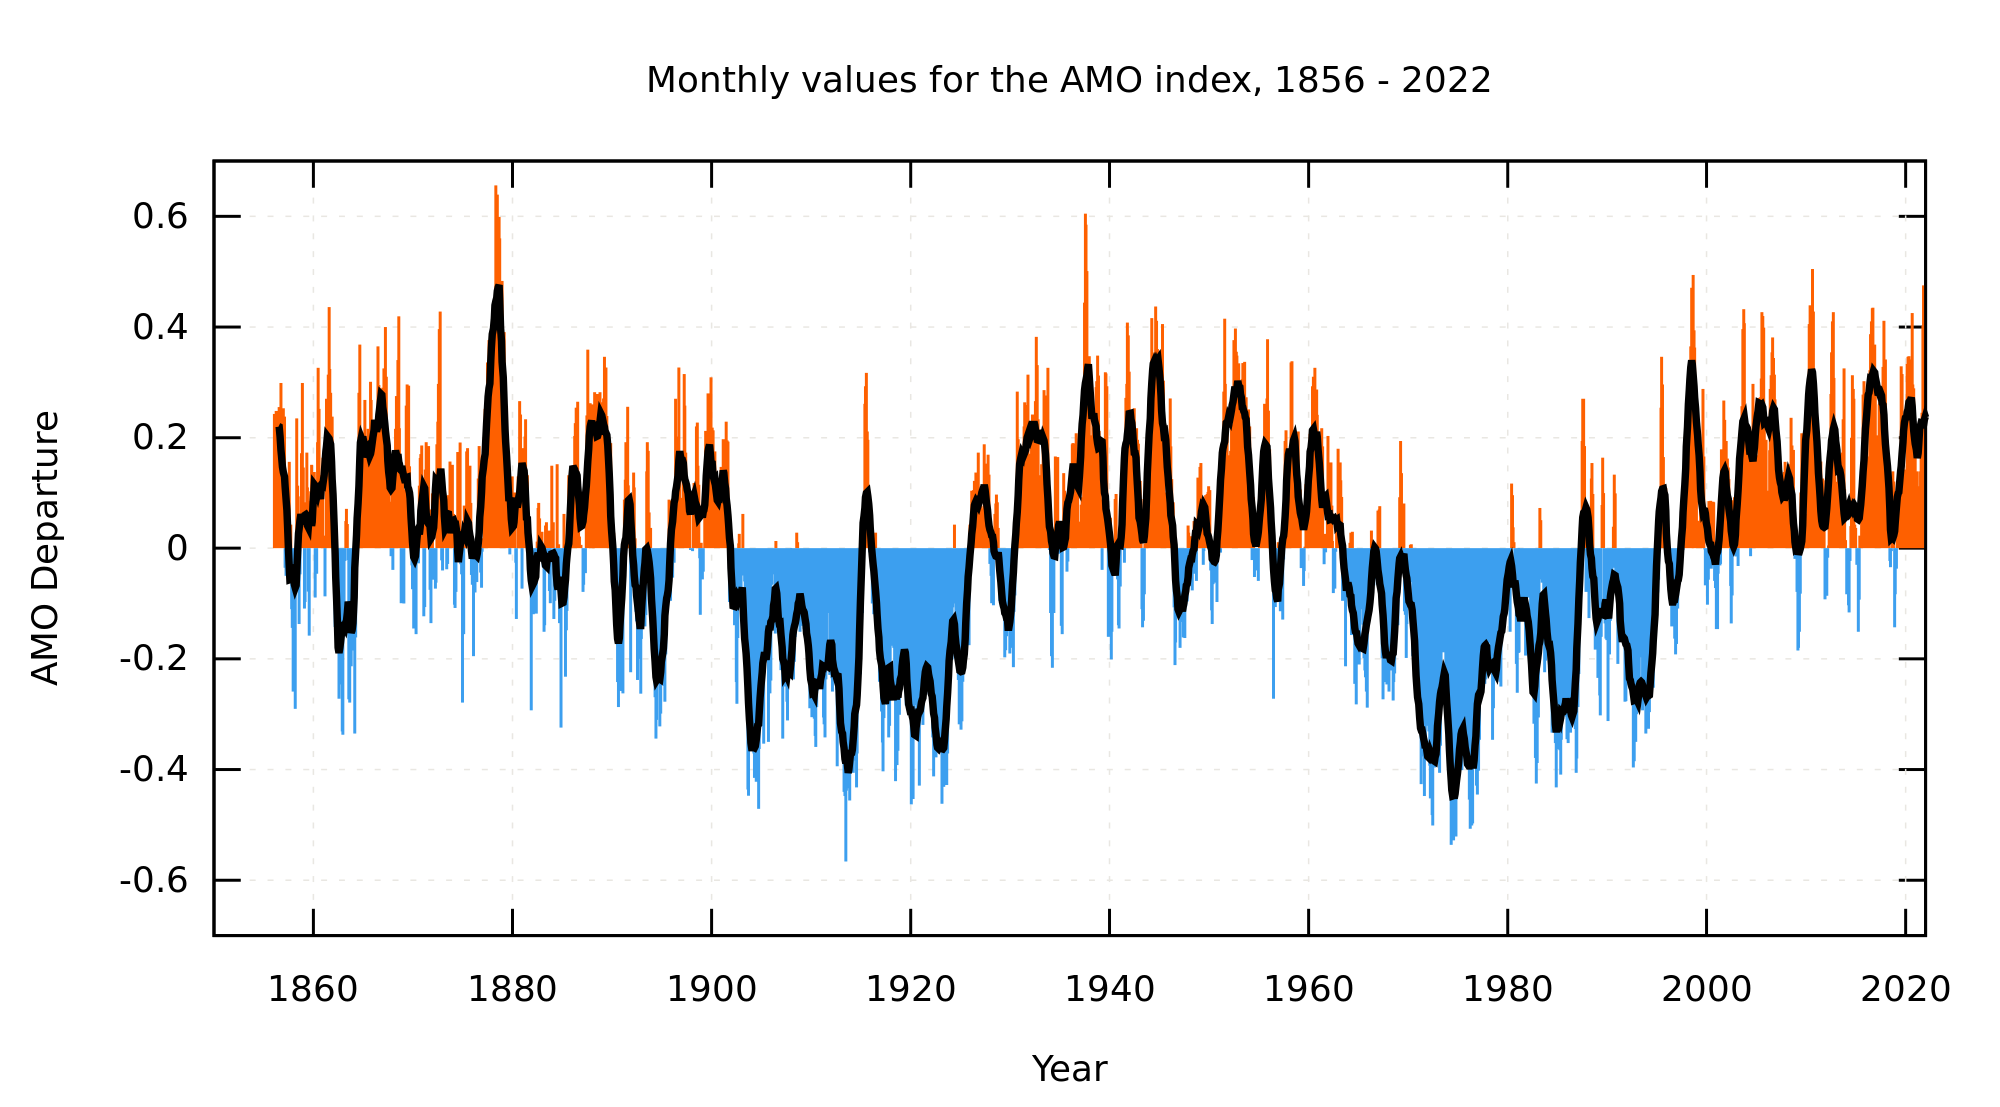
1) Cherry pick your timeframe and you can prove any thesis you want.

The climate is constantly changing and it is easy enough to cherry pick some timeframe which “proves” your preferred thesis. This is the most common “trick” of all in the climate alarmist community of snake oil salesmen.

Anybody who understands glacial/interglacial cycles and the Milankovitch Cycles which drive them knows that the best trend line to examine would cover at least a large majority of the entire Holocene (the current interglacial warming period).

When we look at the best studies covering that timeframe, we find that 
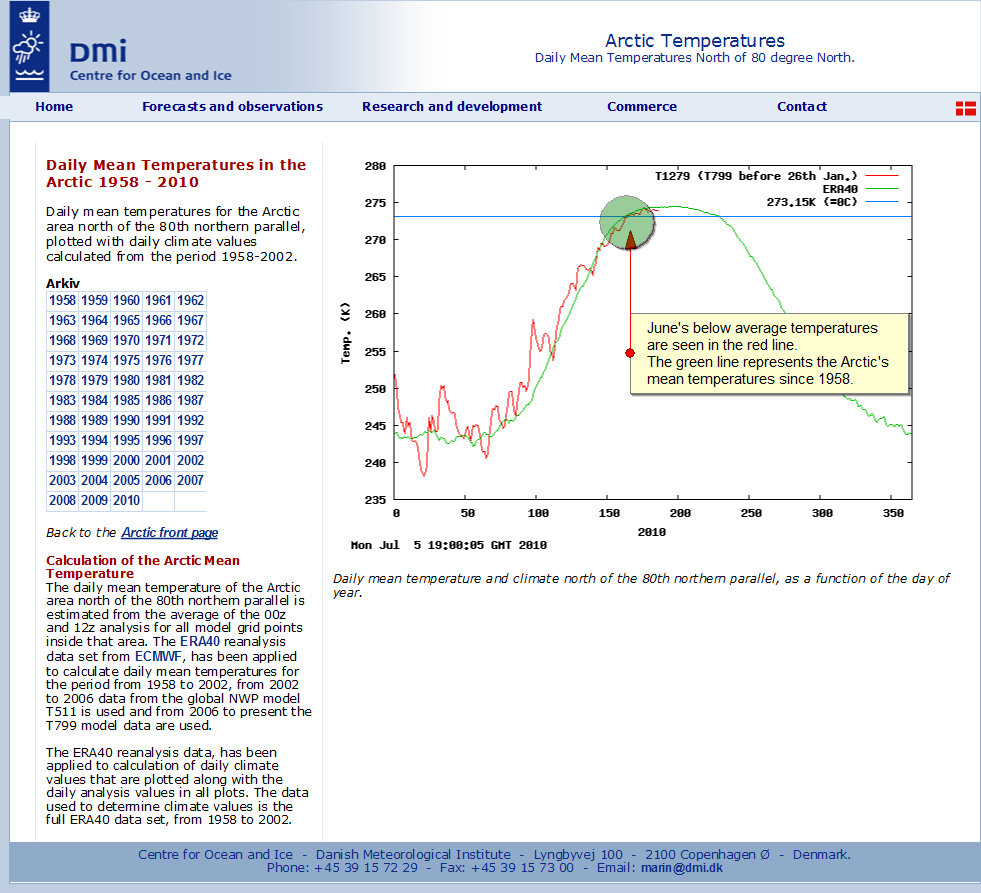
both the Arctic AND the Antarctic are experiencing an on-going, uninterrupted 10,000 year cooling trend which shows NO SIGNS of abating.

The citation links and more details are found here and here.

So, there you have it -- the most relevant time period shows that the planet has been cooling for a very long time now (and -- recent warming notwithstanding -- continues to do so).

2) Garbage In/Garbage Out

That angle was covered quite nicely here. That source also cited my blog -- thank you very much!

3) Currently cooling or just not warming?

That’s a fine line. But, even the very most prominent alarmists (relying upon the most compromised data) admit that the planet has not been warming for quite some time now:

The alarmists at NOAA admit there has been no global warming since 1998:
“The trend in the ENSO-related component for 1999–2008 is +0.08±0.07°C decade, fully accounting for the overall observed trend. The trend after removing ENSO (the "ENSO-adjusted" trend) is 0.00°±0.05°C decade.”
NOAA further admits that:
“The [computer model] simulations rule out (at the 95% level) zero trends [in global temperatures] for intervals of 15 yr or more, suggesting that an observed absence of warming of this duration is needed to create a discrepancy with the expected present-day warming rate.”
Dr. Phil Jones [of ClimateGate infamy] has now admitted that there has been no statistically significant global warming in the last 15 years. Click here for a more technical description of this mathematical analysis from PhD physicist Dr. Luboš Motl.

Therefore, by NOAA’s own standards, the IPCC computer models -- the SOLE SOURCE of ALL climate change hysteria mongering -- have been officially invalidated!

Additionally, peer reviewed science from May of 2008 suggests that:
“global surface temperature may not increase over the next decade”
It looks like we’re in for a NOAA/IPCC busting 25 years (or more) without any warming!

Click here to further challenge the IPCC computer models.

4) Relevancy? Alarmists are notorious for asking all the wrong questions and providing utterly irrelevant “answers”.

Does it really matter whether the planet is currently warming or currently cooling? Isn’t the real question whether current temperatures and current trends are -- in ANY way -- even remotely unusual?

The answer is that peer reviewed science -- all across the board -- clearly demonstrates that there is nothing even remotely unusual about ANY of the current temperatures or ANY of the current trends. To prove that, visit either or both of the links below:

Click here for some basic climate change science.
Click here & debunk climate hysteria topic by topic.

Wednesday, July 7, 2010

Arctic chills down

Quoting Lawrence Solomon
(I inserted the link):
“The Arctic shows no signs of warming, according to the latest data from the Danish Meteorological Institute’s Centre for Ocean and Ice. Last month, in fact, virtually every single day saw temperatures below the mean experienced over the last half-century. The Danish data – taken daily – casts doubt on climate models that had predicted a steady warming of the Arctic.”
Click the image & read the rest:
Click the image & read the rest

Meantime, at the moment, Arctic sea ice extent is at an interesting juncture.

April saw a nine year high and June (paradoxically) saw a nine year low.

The “interesting juncture” is evident in this graph. We have a near intersection of 2010, 2006 and 2007 data. The minima for sea ice extent was considerably different for 2006 and 2007. The question is whether the 2010 minima will more close resemble 2006 or 2007. Given the current trajectory, I’m betting 2010 will more closely resemble 2006. Time will tell.

Click here for current Arctic sea ice extent data.
Click here for more on Arctic sea ice hysteria.

Friday, June 11, 2010

May Update - Current USA Cooling Trend

1) This post deals with USA temperatures.
The previous post covered March & April data.
2) Click here to address global temperature trends.
3) Click here to reproduce each NOAA graph below.
4) Note the warming bias (about 30%) in NOAA data.


25 Year Cooling Trend for May.
Click the image to enlarge it:


24 Year Cooling Trend for Year to Date.
Click the image to enlarge it:


Please! Tell me again who thinks it is a good idea to utterly waste $45 TRILLION in order to pretend we can micromanage climate change. Kyoto has already PROVEN that we can waste all the money we want and we will not even come CLOSE to changing the global temperature in any way which could even be measured.

Furthermore, history tells us that the estimate of $45 TRILLION would balloon into at LEAST a full order of magnitude above that figure.

Click here for some basic climate change science.

Tuesday, May 11, 2010

April Update - Current USA Cooling Trend

1) This post deals with USA temperatures.
The previous post covered February data.
2) Click here to address global temperature trends.
3) Click here to reproduce each NOAA graph below.
4) Note the warming bias (about 30%) in NOAA data.


24 Year Cooling Trend for March.
Click the image to enlarge it:


24 Year Cooling Trend for April.
Click the image to enlarge it:


24 Year Cooling Trend for Year to Date.
Click the image to enlarge it:


Please! Tell me again who thinks it is a good idea to utterly waste $45 TRILLION in order to pretend we can micromanage climate change. Kyoto has already PROVEN that we can waste all the money we want and we will not even come CLOSE to changing the global temperature in any way which could even be measured.

Furthermore, history tells us that the estimate of $45 TRILLION would balloon into at LEAST a full order of magnitude above that figure.

Click here for some basic climate change science.

Wednesday, March 17, 2010

February accelerates USA cooling trends

1) This post deals with USA temperatures.
2) Click here to address global temperature trends.
3) Click here to reproduce each NOAA graph below.
4) Note the warming bias (about 30%) in NOAA data.


February, 1998-2010
Click the image to enlarge it:

Click the image to enlarge it
1) February, 2010 was 2.24 F COLDER than the avg. Feb. of the 20th century!
2) We see a twelve year February COOLING TREND of -4.61 F per decade!


February, 1981-2010
Click the image to enlarge it:

Click the image to enlarge it
We see a TWENTY-NINE year February cooling trend of -0.13 F per decade!


Winter, 1998-2010
Click the image to enlarge it:

Click the image to enlarge it
1) Winter, 2010 was 1.76 F COLDER than the avg. winter of the 20th century!
2) We see a twelve year winter COOLING TREND of -3.15 F per decade!


Winter, 1987-2010
Click the image to enlarge it:

Click the image to enlarge it
NO WINTER WARMING TREND over the last TWENTY-THREE years!


Click here for some basic climate change science.
Click here to examine EPA tyranny.


Saturday, March 6, 2010

2010 - Another Downer for Arctic Sea Ice Hysteria Mongers?

Every year -- about this time -- the usual Arctic sea ice hysteria mongers stand on the street corner and scream their prophecies of doom.

This chart demonstrates that 2009 and 2008 were a disappointment to the merchants of hysteria.

This post on Accuweather.com reflects what I view as the determination of the NSIDC to paint this year as being on a par with the recent minima of 2006-2007. Note - I believe Accuweather.com is about as free of bias as one can hope for -- all views are fairly presented.

As recently as 3/3/10 -- oblivious to an obvious divergence, apparent even in their own chart -- the alarmists at NSIDC were still asserting that:
“In February, Arctic sea ice extent continued to track below the average, and near the levels observed for February 2007.”
However, year to date Arctic temperatures are currently trending lower than recent years. And this has probably been a contributing factor in a recent sharp rapid rise in the Arctic sea ice extent.

With a vast multitude of recent blows to the credibility of the church of man made global warming hysteria, I suspect the alarmists at NSIDC are desperate for a new record low (for the last few decades) in Arctic sea ice extent. But, if current trends hold, they might have set themselves up -- yet again -- for a hefty dose of egg on their faces.

Time will tell.

Meantime, examine the recent trends in Arctic temperatures and Arctic sea ice extent.

Arctic temperatures - YTD 2010
Click the image to enlarge it:
Click the image to enlarge it
Click here for the source.

Arctic temperatures - 2009
Click the image to enlarge it:
Click the image to enlarge it
Click here for the source.

Arctic Sea Ice Extent - Notice 2010 in red
Click the image to enlarge it:
Click the image to enlarge it
Click here for the source.


Click here to debunk the Arctic sea ice hysteria mongering.
Click here for some basic climate change science.

Monday, February 8, 2010

January Continues a 20 Year USA Cooling Trend

UAH Satellite data showed January, 2010 to be a record (for January) within the context of the 32 year dataset.

But, as alluded to in the first link, January 2010 continued a 20 year cooling trend for the Continental USA.

Click the image to enlarge it:
Click the image to enlarge it
Click here to reproduce the above chart.
Select January, start date of 1990, end date of 2010.

What meaning we tease from this contrasting data remains to be seen.
My guess is the 25 year global trend remains intact.

Tuesday, January 12, 2010

A 25 Year Global Cooling Trend

This article in the Daily Mail, describing “a global trend towards cooler weather that is likely to last for 20 or 30 years” has certainly stirred the AGW hysteria pot. Click here and here for the peer reviewed science behind the story.

But, what if I told you the planet is already 25 years into a global cooling trend? Well, if we’re talking about the annual rate of global temperature change, even the government funded alarmists at NOAA know -- for certain -- this is the case.

2/19/10 Update & Correction:
On closer inspection, I find I originally misinterpreted the NOAA chart below. The Y axis -- described as “Temperature Change” -- does NOT describe an annual change from one year to the next. Rather, it describes, after ENSO-adjustment, the total (warming biased) temperature change from the year on the X axis all the way through 2008.

Therefore, while the chart does clearly depict a recent flattening of the previous warming trend and even a recent cooling trend, it does not describe -- as I previously thought -- a 25 year decline in the annual rate of global temperature change.

Of greater significance is the following:

1) We see an on-going, uninterrupted 10,000 year cooling trend in BOTH the Arctic AND the Antarctic.

The citation links and more details are found here and here.

2) Click here for a game changing temperature trend revelation found at the intersection of the NOAA report cited in this post and recent admissions from the climate scientist at the center of the ClimateGate scandal.

Examine this NOAA chart.
Click the image to enlarge it:

Click the image to enlarge it
Click here & jump to page 23 to find the above chart.
Be patient. This is a very large (15MB) file.
Or, see the relevant section as extracted by the U.K. Met Office.

Click here for more on the current cooling trend.
Click here for some basic climate change science.

Friday, January 8, 2010

The Accelerating USA Cooling Trend

Click here to readily reproduce each NOAA graph below.

NOAA data indicate that the continental USA cooling trend accelerated by 32% in 2009. This trend has been in place for ELEVEN years now! At WHAT point will the utterly dishonest alarmists admit this is climate trend rather than a weather event?

The 1998 to 2008 cooling trend was 0.78F per decade.
Click the image to enlarge it:

Click the image to enlarge it

The 1998 to 2009 cooling trend was 1.03F per decade.
Click the image to enlarge it:

Click the image to enlarge it

1.03F / 0.78F = 1.32
(a 32% acceleration in the cooling trend)
Click here for more on the current cooling trend.
Click here for some basic climate change science.

Thursday, January 7, 2010

It's Raining Frozen Iguanas!

Click the image & read the story:
Click the image & read the story
Click here for some basic climate change science.
Here in Steamboat Springs, the forecast calls for -22F tonight.
At 10:40PM, it is already down to -12F.
1/8/10 Update: -22F was, indeed, the low temperature this morning.

Friday, December 4, 2009

Houston Snowfall Breaks TWO Records!

Quoting The Houston Chronicle (emphasis mine):
“Today's daylong snowfall, the earliest in Houston's history, is beginning to let up as the storm system that caused it moves eastward…

The National Weather Service noted that it's the first time Houston has had two consecutive years of measurable snow.”
Click the image & read the rest:
Click the image & read the rest
So much for shorter, warmer winters!
Winter is still more than two weeks away!
Yes, I know the difference between weather and climate.
Click here to debunk the climate angle.

Hot Topics:

BEST Data - No Warming Over Last Decade
The AMO as a Driver of Climate Change
Fact check - The wealthy already pay more taxes
Rare Earth Elements Spell Doom for Green Fantasies
Wikipedia’s Climate Doctor
ClimateGate - The latest updates
Dr. Tim Ball on ClimateGate - The end of AGW hysteria?
ClimateGate: The Musical - Hide The Decline!
Lindzen and Choi SHATTER the IPCC Computer models!
It’s OFFICIAL! We HAVE elected our own Hugo Chavez!
Health Care “Reform”
Cap & Trade - It’s just a giant tax (on EVERYBODY)
The Radicals in the White House
ACORN - The truth
Transparency - Obama promised it. So, where is it?
The Cause of the Housing Debacle
Fiscal Responsibility - In Obama’s Fantasy World
Atlas Shrugged: From Fiction to Fact in 52 Years
Iraq War Media Deceptions 101 - Why the Iraq invasion was justified and necessary
Climate Change 101 - Learn what the SCIENCE says about the biggest hoax EVER!
Obama - on Climate Change
Obama’s Climate Czar - The most dangerous politician in the United States
Obama’s Climate Czar - Her Socialist revolution has begun
Compare the current recession to previous recessions
Obama - Historic & Catastrophic!
Is Obama a Socialist? You BETCHA!
Makers & Takers - Spread the wealth
Obama = International Crisis
The economic case against Obama
The comprehensive case against Obama
The deficit case against the Dems
A Liberal Supermajority? Watch Out!
Examine the series you should have read before voting!
Maggie’s Totalitarian Political Religion
“Kill him!” - Just another media lie?
Journalistic Integrity? - WHERE?
The post about the TED Spread
Save the nation from the Entitlement binge!
Market Reaction to $700 Billion Bailout Vote
Drill Here, Drill Now - Quantitative Facts
ANWR - Drill There, Drill Now
ANWR Matters - Here’s why
Coal Liquefaction (Liquid Fuels From Coal)
The Ethanol Debacle
Pickens Plan - Don’t Fall For it!
Energy Tomorrow Radio - GOOD Stuff!
Economic Forecast
Iraq
Obama
More…

Labels

Blog Archive