Monday, October 31, 2011

The AMO Driving BEST Climate Change

Updated on 10/31/11
Located & cited actual calculated OLS liner trends.
I had previously eyeballed it from the OLS charts.
Changes were minuscule & conclusions unchanged.

This post documents that, once we correct for the Atlantic Multidecadal Oscillation, the newly released BEST data show an average global warming rate of 0.5C/100 years. This is identical to the multi-century NATURAL steady warming rate of “0.5°C/100 years” described by peer reviewed science (Akasofu, 2010).

The BEST data recently debuted with a firestorm soon erupting between the two co-authors of four BEST papers. In the preceding link it is suggested that the BEST data indicate “the planet has warmed by almost a degree centigrade since 1950”.

But, in the aforementioned firestorm, even Muller admits that:
“the BEST data suggested that world temperatures have not risen for about 13 years”
That observation leads Judith Curry to confirm she is accurately quoted to say:
“Whatever it is that’s going on here, it doesn’t look like it’s being dominated by CO2”
That caused me to ponder what the BEST data would show if we examined the exact same time frames I used in a previous analysis of the impact of the Atlantic Multidecadal Oscillation (aka AMO) on temperature trends in the USA. I did just that and arrived at the conclusion described in the first paragraph.

Here’s how I got there…

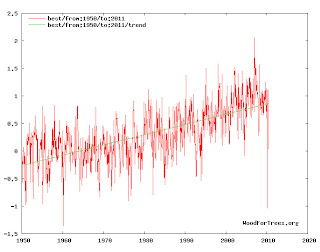
1950 to 2011
(The last data point available is 5/2010.)
The period accurately alleged to show a warming of 1C.
Click the image to enlarge it:
Click the image to enlarge it
Click here for the source.

But, what happens when our start & stop dates
are selected at similar points in the AMO cycle?


1913 to 1976
(The bottom of the two most recent AMO cooling cycles)
Click the image to enlarge it:
Click the image to enlarge it
Click here for the source.
Linear OLS trend = 0.0025558C/year (0.25558C/100 years).

1938 to 1998
(The peak of the two most recent AMO warming cycles)
Click the image to enlarge it:
Click the image to enlarge it
Click here for the source.
Linear OLS trend = 0.00745215C/year (0.745215C/100 years).

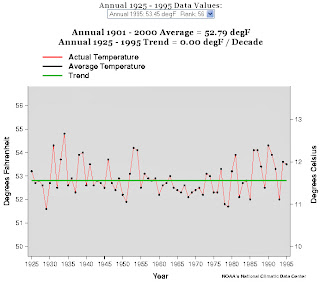
1925 to 1995
(The point where two AMO warming cycles cross the baseline)
Click the image to enlarge it:
Click the image to enlarge it
Click here for the source.
Linear OLS trend = 0.00508102C/year (0.508102C/100 years).

The average warming rate for these three samples is 0.5C/100 years. Again, this is identical to the multi-century NATURAL steady warming rate of “0.5°C/100 years” described by peer reviewed science (Akasofu, 2010).

Click here & see how the AMO killed the CAGW cult.
Click here for some basic climate change science.
Click here to debunk the hysteria topic by topic.

Sunday, October 30, 2011

BEST Data - No Warming Over Last Decade

Quoting David Rose
at The Mail on Sunday (emphasis mine):
“It was hailed as the scientific study that ended the global warming debate once and for all – the research that, in the words of its director, ‘proved you should not be a sceptic, at least not any longer’.

Professor Richard Muller, of Berkeley University in California, and his colleagues from the Berkeley Earth Surface Temperatures project team (BEST) claimed to have shown that the planet has warmed by almost a degree centigrade since 1950 and is warming continually…


[Click here for a paper demonstrating a warming rate of 0.7C per CENTURY from 1958 to 1998.

Click here to examine the NATURAL DRIVERS of that warming.

Click here & here to put that warming into proper perspective.]

Prof Judith Curry, who chairs the Department of Earth and Atmospheric Sciences at America’s prestigious Georgia Institute of Technology, said that Prof Muller’s claim that he has proven global warming sceptics wrong was also a ‘huge mistake’, with no scientific basis

In fact, Prof Curry said, the project’s research data show there has been no increase in world temperatures since the end of the Nineties – a fact confirmed by a new analysis that The Mail on Sunday has obtained.”
Click the image & read the rest:
Click the image & read the rest
Click here to enlarge the image.
Click here for the cited post at the Global Warming Policy Foundation.

Click here for commentary.
Click here for a critique of the BEST data processing algorithms.

Click here to examine a BEST rewriting of temperature history.
Do we have yet ANOTHER ClimateGate brewing here?

Click here for some basic climate change science.
Click here to debunk the hysteria topic by topic.

Saturday, October 29, 2011

Some belated parental advice to protesters

Quoting Marybeth Hicks
at The Washington Times:
“Call it an occupational hazard, but I can’t look at the Occupy Wall Street protesters without thinking, ‘Who parented these people?’…

As a culture columnist, I’ve commented on the social and political ramifications of the ‘movement’ - now known as ‘OWS’ - whose fairyland agenda can be summarized by one of their placards: ‘Everything for everybody.’…

Here, then, are five things the OWS protesters’ mothers should have taught their children but obviously didn’t, so I will:”
Click the image & read the rest:
Click the image & read the rest
Click here for the image credit
(from Occupy Denver).

Click here for all OWS posts.

The Goat Rodeo Sessions

Yo-Yo Ma is the centerpiece of a new Blue Grass recording titled “The Goat Rodeo Sessions”.

Aoife O'donovan (from Crooked Still) is a featured vocalist.

This could be a winner!

From The Goat Rodeo Sessions,
Here and Heaven:


Click here for a better version performed on The Tonight Show.
Click here to glimpse some lyrics from “Here and Heaven”.
Click here for another song off the recording (No One But You).

Friday, October 28, 2011

NewsBusted Video - 10/28/11

NewsBusted Comedy Show From 10/28/11:

Click here to view more NewsBusted comedy.

Whittle Analyzes the OWS Mob


Click here for an example of what Whittle describes.
Click here to understand what this mob should be protesting.
Click here for all OWS posts.

Tuesday, October 25, 2011

OWS Protester Wants his Tuition Paid

Because the “Progressive” Entitlement Baby wants
what the “Progressive” Entitlement Baby wants:


Click here for a related essay.
Click here for all OWS posts.

Sunday, October 23, 2011

OWS Protests Their Own Financial Sector

Shockingly, even in the people’s paradise of Zuccotti Park, there is displeasure with the distribution of wealth (as administered by the bureaucrats of the local Finance politburo). George Orwell’s Animal Farm comes to mind.

Quoting Ginger Adams Otis
at The New York Post:
“Occupy Wall Street’s Finance Committee has nearly $500,000 in the bank, and donations continue to pour in -- but its reluctance to share the wealth with other protesters is fraying tempers.”
Will they soon be eating their own?
Click the image & read the rest:

Click the image & read the rest
Click here for the image credit
(from Occupy Denver).
Click here for all OWS posts.

Saturday, October 22, 2011

The AMO as a Driver of Climate Change

Updated on 10/22/11 at 10:29PM MST
Added a fourth chart.

The following primarily deals with the impact of the Atlantic Multidecadal Oscillation (aka AMO) on temperature trends in the USA. Click here to examine the global impact. Click here to examine the USA impact in more detail.

I have previously asserted that any honest analysis of temperature trends must begin and end at similar points in the AMO cycle. This is particularly true for USA temperature trends.

Global warming hysteria mongers frequently claim that the warming of the last 30 to 35 years was primarily caused by humans. But, when examining USA data, if one simply insists upon looking only at trends which begin and end at similar points in the AMO cycle, that much hyped warming (human induced or otherwise) virtually disappears.

The following charts show that -- from 1913, forward -- there is virtually no USA warming which cannot be explained by AMO warming cycles. So, if humans are warming the entire planet at a catastrophic rate, why -- once we correct for the AMO cycles -- is this not evident in the USA?

In the following three charts, I have selected beginning and ending dates based upon a Wikipedia chart of the AMO index and (more precisely) the raw data from NOAA from which that chart was derived.

Click here to reproduce each of the charts below.

1913 to 1976
(The bottom of the two most recent AMO cooling cycles)
Click the image to enlarge it:
Click the image to enlarge it
The trend rate is 0.01F per decade
(0.1F per CENTURY).


1938 to 1998
(The peak of the two most recent AMO warming cycles)
Click the image to enlarge it:
Click the image to enlarge it
The trend rate is 0.05F per decade
(0.5F per CENTURY)

0.5F per century is about HALF the:
trend rate of 0.5°C per century since… the 1700s

1925 to 1995
(The point where two AMO warming cycles cross the baseline)
Click the image to enlarge it:
Click the image to enlarge it
The trend rate is 0.00F per decade
(0.0F per CENTURY).


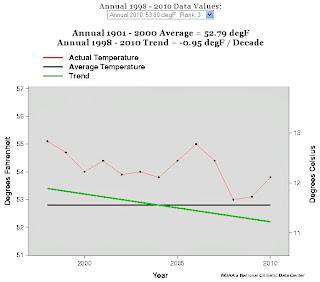
Not covered in the above 3 charts is 1998 to 2010.
The chart shows an AMO cooling phase for that period.
And, surprise, surprise -- so do USA temperatures.
Click the image to enlarge it:
Click the image to enlarge it
The trend rate is -0.95F per decade
(-9.5F per century).

Time for a global cooling panic? No!
Just a brief cooling phase -- nothing unusual
(just like the brief warming phase which preceded it).

So…
The IPCC tells us that human activity has been the primary driver of temperature trends over the last century. But, the data make it perfectly clear that the AMO has been the primary driver of temperature trends over the last century -- especially in the USA. I submit to you that the AMO will continue to be the primary driver of climate change over the next century as well.

Click here for some basic climate change science.
Click here to debunk the hysteria topic by topic.

Friday, October 21, 2011

Orbach Trips Over the AMO & Fails to See it

Updated on 10/22/11 at 11:09AM MDT
An additional timeframe analysis was added.
Post was reworded for clarity & consistency.

In a prior post, I destroyed a letter to the Wall Street Journal editor sent in by CAGW apologist Raymond L. Orbach. The perfectly natural AMO warming cycle was the foundation for that debunking.

The most recent AMO warming cycle began around 1976 and peaked around 1998. Now, we see a quote from Orbach himself wherein he stumbles upon the AMO warming cycle and still fails to see it.

Quoting Raymond L. Orbach:
“When I started looking at literature, I noticed that there was warming beginning in 1980”
Quoting the so-called “journalist”
who wrote this purely political propaganda piece:
“The National Oceanic and Atmospheric Administration reports that temperatures across the United States have increased by 1.5 degrees since the 1970s.”
True enough. Click here and chart NOAA annual data from 1975 through 2010. You’ll find a trend rate of 0.51F per decade over a period of roughly 3 decades and you can reasonably reach the same conclusion.

But, the time frame of 1975 through 2010 is egregiously cherry picked. It begins around the bottom of an AMO cooling cycle and ends around the top of an AMO warming cycle. Furthermore, click here and see that peer reviewed science finds “an estimated warm bias of about 30%” in the NOAA data (meaning the actual temperature increase over this cherry picked timeframe is more like 1.05F).

Any reasonable trend analysis would have to begin and end at a similar point in the AMO cycle. In each analysis below, I have selected start dates and end dates which reflect similar points in the AMO cycle based upon a Wikipedia chart of the AMO index and (more precisely) the raw data from NOAA from which that chart was derived.

An AMO cooling cycle bottomed out in 1913. The most recent AMO cooling cycle bottomed out in 1976. Click here and chart the annual average USA temperature over that time frame (1913 to 1976). You’ll find a CAGW busting trend rate of 0.01F per decade!

An AMO warming cycle peaked in 1933. The most recent AMO warming cycle peaked in 1998. Click here and chart the annual average USA temperature over that time frame (1933 to 1998). You’ll find a CAGW busting trend rate of 0.01F per decade!

Between these two extremes, let’s pick equivalent moments when the AMO cycle crossed the baseline in the chart. Start at 1925 (when an AMO warming cycle crossed the baseline) and end in 1995 (when the most recent AMO warming cycle crossed the baseline). Click here and chart the annual average USA temperature over that timeframe (1925 to 1995). You’ll find a CAGW busting trend rate of 0.00F per decade!

Finally, let’s compare the AMO warming cycle timeframe of the last 3 decades to the previous AMO warming cycle. An AMO warming cycle began in 1913 and peaked in 1933. Chart the average annual USA temperature over that timeframe (1912 to 1934). You’ll find a trend rate of 0.56F per decade (slightly higher than the 0.51F per decade figure cited by our so-called “journalist”).

Click here for some basic climate change science.
Click here to debunk the hysteria topic by topic.
Tuesday, October 18, 2011

Polling the Occupy Wall Street Mob

Below, I am quoting longtime Democrat Douglas Schoen (former pollster for Bill Clinton). Schoen compares the 1970 violent and destructive protestors to the current Occupy Wall Street protestors. Schoen correctly notes that the 1970 protestors then represented the lunatic fringe of the Democrats. Schoen mistakenly believes the current Occupy Wall Street protestors are the analog of their 1970 counterparts. He’s wrong.

The Occupy Wall Street mob now represents the base of the Democrat Party. Schoen advises the Dims to distance themselves from this mob. They cannot and will not -- this is their base. In 2012, their own base will bring them down.

Today, Dims can only win elections by cleverly disguising who they really are. Obama won by pretending to be a moderate. Does anybody believe that anymore? The Occupy Wall Street mob has forced their hand. They can no longer pretend they are not radical Socialists. They are now forced to admit it. In doing so, the Dims will lose the Independent vote and, thereby, lose the 2012 elections.

For that, the rest of America owes a debt of gratitude to the OWS mob and all the affiliate mobs.

Quoting Douglas Schoen
at The Wall Street Journal:
“President Obama and the Democratic leadership are making a critical error in embracing the Occupy Wall Street movement—and it may cost them the 2012 election…

The protesters have a distinct ideology and are bound by a deep commitment to radical left-wing policies….

nearly one-third (31%) would support violence to advance their agenda.”
Click the image (from Occupy Denver)
& read the rest:

Click the image & read the rest
Click here for a more realistic look at the Occupy Mob.
Click here for all OWS posts.

Wednesday, October 12, 2011

Debunking Raymond L. Orbach's CAGW Letter

Updated on 10/13/11 at 1:16PM MDT to include more info.

True believers in the catastrophic man made global warming myth seem impressed by a letter to the WSJ editor by one Raymond L. Orbach. So, let’s debunk it:

1) Orbach’s central point is that satellite data show a warming trend over the last 30 years. True enough (thanks to the most recent -- perfectly natural -- AMO warming cycle). Carefully examine that link in it’s entirety and you’ll find all that is necessary to fully debunk Orbach’s letter.

Notable in that debunking is the fact that the longer term trend shows the planet has, for hundreds of years, been naturally warming at a steady trend rate of 0.5°C per century -- a full order of magnitude LESS than the (not at all unusual) 30 year AMO driven trend touted by Orbach. What follows is just (some very tasty) icing on the cake.

2) Orbach cites a paper allegedly claiming that a trend of at least 17 years is required “to detect overall trends.”

I have a theory as to how that (odd) number was calculated -- pretty simple really:

A) NOAA is on record stating:
“The trend in the ENSO-related component for 1999–2008 is +0.08±0.07°C decade, fully accounting for the overall observed trend. The trend after removing ENSO (the "ENSO-adjusted" trend) is 0.00°±0.05°C decade.”
2010 was an El Nino driven warm year (part of the ENSO variations). Hence, the satellite data demonstrate that the ENSO-adjusted flat trend continues (making for 13 years without any global warming).

B) Phil Jones (of ClimateGate infamy) is on record stating that there has been no “statistically significant” global warming since 1995 (16 years ago). That assessment, by the way, met NOAA’s 15 year standard for invalidating all the IPCC computer models (see the link for substantiation).

So, is it mere coincidence that 17 years is now determined to be the (revised) magical number? You decide.

3) The nature of climate change is that there are countless natural cycles embedded within other natural cycles (which, in turn, are embedded within still more natural cycles). Human activity has probably contributed some very tiny (and utterly inconsequential) amount of warming. But, the fact is that there is nothing about current temperatures or current trends which is even remotely close to falling outside the bounds of natural variations.

Truth is, the warmists always want us to examine only their carefully cherry picked date ranges (and ignore all others). They are particularly keen on making sure we never look as far back as the previous (perfectly natural) interglacial warming period (much less the 3 very similar warming periods which preceded that one). Yeah, the data from those Vostok ice cores are particularly “inconvenient”, eh?

Click here for some basic climate change science.
Click here to debunk the hysteria topic by topic.
Wall Street Mob - You LIE!

So-called “Progressives” always lie. Their entire ideology is pure mythology. Ergo, their ideology requires them to lie.

The Occupy Wall Street mob claims to represent 99% of Americans. That is a GIANT lie. It would be extremely generous to say that this mob represents the least productive 10% of Americans. It’s probably more like 1%.

The Occupy Wall Street mob claims the top 1% do not pay their “fair share”. Nothing could be farther from the truth.

Click the image & debunk the lies:
Click the image, debunk the lies
Click here for more facts on who pays what.
Click here for all OWS posts.

Tuesday, October 11, 2011

A Dispatch from Inside Occupy DC

The entire Occupy _____ (fill in the blank) movement is hopelessly ill-informed.

As I extensively documented in a prior post, the financial sector was guilty only of doing exactly what Big Government enabled and encouraged them to do. The protestors are right to be angry. But, their anger is misdirected. They should be protesting the Corruptocrats in the Democrat Party who undeniably created this mess (and then -- by pursuing policies long ago proven to consistently fail -- proceeded to make it far, FAR worse).

Below, find a sampling of the Occupy DC mob:

Click here for more details on this video.
Click here for all OWS posts.

Sunday, October 9, 2011

Johnny Cashless Sings 'Obama's Prison Blues'

Johnny Cashless sings
“Obama’s Prison Blues”:


Click here for the September edition of Obama’s Epic Failure.

Foster The People - Pumped up Kicks

On balance, I detest SNL. In general, SNL substantiates the case that the so-called “Progressive” ideology is a mental disorder (with Manhattan being ground zero for the most severe manifestation of said mental disorder).

Never the less, there are three reasons why I DVR every new episode of SNL (and then watch, at most, about 15 to 20 minutes of the program).

1) The opening skit is occasionally amusing (this week was not).

2) Weekend Update is usually amusing (even when spewing Leftist propaganda).

3) SNL is my one remaining connection to the world of pop music. Usually, this segment only causes me to shake my head at what passes for talent these days. But, on very rare occasions, I find something at least marginally impressive (or, if not impressive, at least fresh, original, creative, unique or otherwise intriguing).

Last week, the country music group Lady Antebellum was enjoyable. One thing I appreciated was a very attractive female performer who -- unlike most these days -- was NOT dressed like a $2 hooker. Their song -- Just a Kiss -- was sweet, innocent and charming. Their other song -- We Owned the Night -- was also a good one.

This week, the musical guest was “Foster the People”. The name was familiar. But, I had never sampled their music. They performed their most popular song - “Pumped up Kicks”.

The music -- composed before the lyrics -- is catchy, upbeat dance music (with a carefree whistling interlude). The lyrics are dark as hell -- getting inside the mind of a homicidal Columbine style perp. It makes for an intriguing contradiction (and style point #1).

SNL being SNL, my expectation was that there was some gun control message lurking in there somewhere -- apparently not.

Mark Foster is quoted to say:
“To me the epidemic isn’t gun violence; the epidemic is lack of family, lack of love, and isolation.”
That sounds like a family values assessment any Conservative could agree with.

Foster the People
perform “Pumped up Kicks” on SNL:


Click here for the official music video.
Click here for another live version (Austin City Limits).
Is the ACL audience a little too into the chorus? Disturbing?
Do they all get it? Is it a massive display of irony in action?
Or, just dumb kids mindlessly regurgitating a catchy chorus?

The second song from Foster the People -- Houdini -- featured a nice soprano sax solo from Kenny G, but did not grab me as much. That said, the lyrics seemed to me to address free speech principles (apparently, trampled upon by MTV), property rights and the virtue of striving to be your best -- again, Conservative values. But, that’s just my interpretation.

Saturday, October 8, 2011

September 2011 Update - USA Temperature Trend

1) This post deals with USA temperatures.
2) Click here to address global temperature trends.
3) Click here to reproduce each NOAA graph below.
4) Note the warming bias (about 30%) in NOAA data.

81 Year USA Trend for September.
A warming of 0.03F per decade?
OMG! Is it time to panic yet?

With the 30% warming bias,
is this actually a cooling trend?

Click the image to enlarge it:

Click the image to enlarge it


Please! Tell me again who thinks it is a good idea to utterly waste $76 TRILLION in order to pretend we can micromanage climate change. Kyoto has already PROVEN that we can waste all the money we want and we will not even come CLOSE to changing the global temperature in any way which could even be measured.

Furthermore, history tells us that the estimate of $76 TRILLION would balloon into at LEAST a full order of magnitude above that figure.

Click here for some basic climate change science.
Click here to debunk the hysteria topic by topic.

Friday, October 7, 2011

Obama's Epic Failure - September Jobs Edition

Quoting The Bureau of Labor Statistics:
“The number of unemployed persons, at 14.0 million, was essentially unchanged in September, and the unemployment rate was 9.1 percent. Since April, the rate has held in a narrow range from 9.0 to 9.2 percent.”
Click the image & read the rest:
Click the image & read the rest
Click here and recall Obama’s empty promises.
Obama promised unemployment would now be about 6.5%.
His own data prove he has made matters MUCH WORSE!
Click here and know why that was entirely predictable.
Click here for the long, sad history of Obama’s epic failure.

Hey! Dims! How’s that hopey changey thing working for you?
MORONS!

Thursday, October 6, 2011

Coulter - This is what a mob looks like

Quoting Ann Coulter
(I inserted the link):
“No one knows what the Wall Street protesters want -- as is typical of mobs. They say they want Obama re-elected, but claim to hate ‘Wall Street.’ You know, the same Wall Street that gave its largest campaign donation in history to Obama, who, in turn, bailed out the banks and made Goldman Sachs the fourth branch of government…

The Canadian environmental group behind Occupy Wall Street, Adbusters, has compared the Wall Street ‘revolutionaries’ to America's founding fathers. (Incidentally, those who opposed the American Revolution fled after the war to ... Canada.)

The -- again -- Canadians exulted, ‘You sense they're drafting a new Declaration of Independence.’”
Click the image
(of an Occupy Wall Street mob member)
& read the rest:
Click the image & read the rest
Coulter’s latest book is titled:
Demonic: How the Liberal Mob Is Endangering America
She is -- as always -- right on target.

Click here for all OWS posts.

Barry - Nobody is listening

Update: Corrected & substantiated the Todd quote.

This morning, President Barry was (once again) monopolizing my TV with more of his 2012 class warfare campaign.

I, of course, had the sound muted.

I occasionally enabled the sound to hear what the so-called “journalists” were asking.

The best question came from Chuck Todd (of MSNBC). Todd asked the President:
“Are you worried about your own powers of persuasion and maybe that the American public is not listening to you any more?”
Obama, of course, did not answer the question. He merely resumed his campaign speech. I hit the mute button.

Wednesday, October 5, 2011

Occupy Wall Street - A Manifesto

Finally!
A Manifesto emerged from Occupy Wall Street.
Does it sound familiar (with a perverted twist)?

Quoting David Harsanyi at Reason.com:
“We hold these truths to be self-evident, that all men, women, and transgendered—and any other human who is able to elude the tyranny of work for a couple of weeks—are created equal. We gather to be free not of tyranny, but of responsibility and college tuitions…

This is the fifth communiqué from the 99.9 percent. We are occupying Wall Street, and we're not going home until it gets really cold.”
Click the image & read the rest:
Click the image & read the rest
Click here to enlarge the image.

Tuesday, October 4, 2011

Did Eric Holder Lie Under Oath?

10/11/11 Correction:
Holder was not under oath on this occasion.
So, even if he lied on this occasion, it would not rise to perjury.
Expect Holder to be placed under oath next time.

Quoting CBS News:
“New documents obtained by CBS News show Attorney General Eric Holder was sent briefings on the controversial Fast and Furious operation as far back as July 2010. That directly contradicts his statement to Congress.”
Click the image & read the rest:
Click the image & read the rest
Click here to enlarge the image.
Click here for commentary.

Evidence indicates Holder is either a liar or an incompetent.
Either way, he’s gotta go.

Holder also runs a race based DOJ
(making Holder perhaps the worst Attorney General ever).

NewsBusted - Cain supporters are racist

NewsBusted Comedy Show From 10/4/11:

Click here to view more NewsBusted comedy.

Saturday, October 1, 2011

Cultural Marxism in the Energy Sector

The one and only doctrine which drives every facet of the Democratic Party is Cultural Marxism (aka Political Correctness).

Quoting a speech by Bill Lind on Political Correctness:
“just as in classical economic Marxism certain groups, i.e. workers and peasants, are a priori good, and other groups, i.e., the bourgeoisie and capital owners, are evil. In the cultural Marxism of Political Correctness certain groups are good – feminist women, (only feminist women, non-feminist women are deemed not to exist) blacks, Hispanics, homosexuals. These groups are determined to be ‘victims,’ and therefore automatically good regardless of what any of them do. Similarly, white males are determined automatically to be evil, thereby becoming the equivalent of the bourgeoisie in economic Marxism.”
So, how does Cultural Marxism translate to the energy sector? Isn’t it obvious? Hydrocarbon energy (and any other product -- like plastic -- derived from hydrocarbons) is a priori evil (a myth routinely reinforced by media lies) and all energy sources labeled “Green” are a priori good (no matter how much evil they perpetrate or how many economies they ruin).

Cultural Marxism in the energy sector manifests itself in many, many ways. The following article examines just one facet -- the brazen hypocrisy surrounding the enforcement of the Migratory Bird Treaty Act. Under this act, seven oil companies have been charged with allegedly killing 28 migratory birds (with an average alleged kill rate of 4 birds per oil company). Meantime, according to The New York Times, wind turbines kill 440,000 birds each year and domestic cats kill 500,000,000 birds each year. Yet, only oil companies have been charged with a crime.

Quoting The Blaze
(which then quotes The Wall Street Journal):
“You may have gotten wind of the seven North Dakota oil companies recently charged in federal court with the deaths of 28 migratory birds.

The birds allegedly landed in oil waste pits in western North Dakota last spring; the maximum penalty for each charge under the Migratory Bird Treaty Act is six months in prison and a $15,000 fine, the AP said.

But did you know that wind-power companies are responsible for more than 400,000 bird deaths annually, and not one has faced a single charge?”
Click the image & read the rest:
Click the image & read the rest
Click here for more on wind power fraud & folly.
Click here & examine domestic energy resources.
Click here for some basic climate change science.
Click here to debunk the hysteria topic by topic.
Hot Topics:

BEST Data - No Warming Over Last Decade
The AMO as a Driver of Climate Change
Fact check - The wealthy already pay more taxes
Rare Earth Elements Spell Doom for Green Fantasies
Wikipedia’s Climate Doctor
ClimateGate - The latest updates
Dr. Tim Ball on ClimateGate - The end of AGW hysteria?
ClimateGate: The Musical - Hide The Decline!
Lindzen and Choi SHATTER the IPCC Computer models!
It’s OFFICIAL! We HAVE elected our own Hugo Chavez!
Health Care “Reform”
Cap & Trade - It’s just a giant tax (on EVERYBODY)
The Radicals in the White House
ACORN - The truth
Transparency - Obama promised it. So, where is it?
The Cause of the Housing Debacle
Fiscal Responsibility - In Obama’s Fantasy World
Atlas Shrugged: From Fiction to Fact in 52 Years
Iraq War Media Deceptions 101 - Why the Iraq invasion was justified and necessary
Climate Change 101 - Learn what the SCIENCE says about the biggest hoax EVER!
Obama - on Climate Change
Obama’s Climate Czar - The most dangerous politician in the United States
Obama’s Climate Czar - Her Socialist revolution has begun
Compare the current recession to previous recessions
Obama - Historic & Catastrophic!
Is Obama a Socialist? You BETCHA!
Makers & Takers - Spread the wealth
Obama = International Crisis
The economic case against Obama
The comprehensive case against Obama
The deficit case against the Dems
A Liberal Supermajority? Watch Out!
Examine the series you should have read before voting!
Maggie’s Totalitarian Political Religion
“Kill him!” - Just another media lie?
Journalistic Integrity? - WHERE?
The post about the TED Spread
Save the nation from the Entitlement binge!
Market Reaction to $700 Billion Bailout Vote
Drill Here, Drill Now - Quantitative Facts
ANWR - Drill There, Drill Now
ANWR Matters - Here’s why
Coal Liquefaction (Liquid Fuels From Coal)
The Ethanol Debacle
Pickens Plan - Don’t Fall For it!
Energy Tomorrow Radio - GOOD Stuff!
Economic Forecast
Iraq
Obama
More…

Labels

Blog Archive