Showing posts with label Climate Change - Surface Temperatures. Show all posts

Sunday, April 1, 2012

Over 15 Years of Global Cooling!

RSS MSU data show over 15 years of global cooling.
(Least squares trend line; slope = -0.000835651 per year)
Note, globally, the particularly COLD winter of 2012.

Click the image to enlarge it: Click the image to enlarge it
Click here for the source.
Click here for the raw data.

By NOAA’s own standards, this cooling trend in excess of 15 years means (with a 95% degree of confidence) all IPCC computer models (the sole source of ALL the climate change hysteria mongering) are FURTHER invalidated and rendered USELESS!

Click here for more on the current cooling trend.

Click here for some basic climate change science.
Click here to debunk the hysteria topic by topic.

Friday, February 10, 2012

Greenland was significantly warmer over the last 4,000 years

Quoting peer reviewed science
from Kobashi, et al. 2011:
“The current decadal average surface temperature (2001–2010) at the GISP2 site is −29.9°C. The record indicates that warmer temperatures were the norm in the earlier part of the past 4000 years, including century-long intervals nearly 1°C warmer than the present decade (2001–2010). Therefore, we conclude that the current decadal mean temperature in Greenland has not exceeded the envelope of natural variability over the past 4000 years”
Click the image (from the paper) to enlarge it:
Click the image (from the paper) to enlarge it
Click here for the abstract.
Click here to see why climate models are a joke.
Click here to further debunk Greenland ice melt hysteria.

Click here for some basic climate change science.
Click here to debunk the hysteria topic by topic.

Sunday, January 29, 2012

Catastrophic Warming -- PANIC NOW! (Part II)

Click here & read Part I first.
Then, see the updates below.


2003 was the first full year of AMSU data collection.
2012 is now substantially COOLER than 2003.
Click the image to enlarge it:
Click the image to enlarge it
Click here to reproduce the above chart.

On 1/23/12 AMSU recorded the COLDEST temperature yet.
In the image below, see the red vertical line.
Click the image to enlarge it:
Click the image to enlarge it
Click here to reproduce the above chart.

Click here for some basic climate change science.
Click here to debunk the hysteria topic by topic.

Wednesday, January 11, 2012

117 Year Flat Temperature Trend in Texas

The previous post examined the lies surrounding the 2011 Texas drought. Most of the propagandists exploiting that drought also made hay about 2011 recording the second highest Texas temperatures on record.

Here are a few “minor” details the propagandists would rather ignore:

1) Peer reviewed science has found a 30% warming bias in NOAA temperature data.

2) The hottest year on record in Texas was 1921.

3) The entire 117 year temperature record shows an absolutely FLAT temperature trend rate of 0.00F per decade (without accounting for the warming bias documented in point #1).

Click the image to enlarge it:
Click the image to enlarge it
Click here to reproduce the above chart.

Click here for some basic climate change science.
Click here to debunk the hysteria topic by topic.

Thursday, January 13, 2011

NOAA Alarmists vs. Peer Reviewed Science

Quoting the government employees at NOAA:
“According to NOAA scientists, 2010 tied with 2005 as the warmest year of the global surface temperature record, beginning in 1880.”
Quoting PhD Climatologist Dr. Roger Pielke Sr.
(emphasis mine):
“Our [peer reviewed] paper… has clearly documented an estimated warm bias of about 30% in the IPCC reported surface temperature trends. This bias also brings into question the claim that 11 of the 12 years in the period 1995 to 2006 were the warmest on record. Moreover, despite the claim in the IPCC (2007) report, the tropospheric and surface temperature trends have not NOT reconciled...

The lack of news coverage on this documented bias which has appeared in the peer reviewed literature on the Klotzbach et al (2009) paper is another clear example of the failure of most of the journalism community to cover news that conflicts with the IPCC (2007) perspective.”
The cited peer reviewed science is:
Klotzbach, P.J., R.A. Pielke Sr., R.A. Pielke Jr., J.R. Christy, and R.T. McNider, 2009: An alternative explanation for differential temperature trends at the surface and in the lower troposphere.

JOURNAL OF GEOPHYSICAL RESEARCH, VOL. 114, D21102, 8 PP., 2009
doi:10.1029/2009JD011841

A previous paper is also cited:
Science 18 February 2000 287: 1227-1232 [DOI: 10.1126/science.287.5456.1227]

Click here and examine the rest of the evidence from Dr. Pielke, including the directly cited peer reviewed science.

Which one do you believe?

Click here for more on surface temperature follies.
Click here for some basic climate change science.
Click here to debunk the hysteria topic by topic.

Tuesday, January 4, 2011

Peeking behind the CAGW alarmist 'True Lies'

Click here for a recent example of CAGW alarmist “true lies” (wherein a CAGW alarmist presents evidence of a linear warming trend apparent in the RSS satellite dataset).

True lies? Yep.

The “true” part relates to the citation of the RSS satellite dataset. Peer reviewed science has demonstrated the IPCC surface temperature data to be wildly unreliable. Therefore, it is encouraging to see the citation of the far more reliable RSS satellite data.

The “lies” (by omission) result from:

1) The failure to provide proper CONTEXT to the RSS data. You see, the RSS data spans January 1979 through today. And, the slight warming trend apparent in that data directly coincides with the 1979 to 1998 AMO warming cycle. That warming cycle plateaued in 1998. Coincidentally (or not) the alarmists at NOAA admit that:
“The trend in the ENSO-related component for 1999–2008 is +0.08±0.07°C decade, fully accounting for the overall observed trend. The trend after removing ENSO (the "ENSO-adjusted" trend) is 0.00°±0.05°C decade.”
2) The failure to note that the 2010 El Niño induced warming is OVER and global temperatures are now back to the statistically flat trend of the last 15 years.

(At least the alarmists at NOAA are honest enough to remove the El Niño induced noise from their presentation of the significance of the data.)

3) The bottom has recently dropped out of the Sea Surface Temperatures.

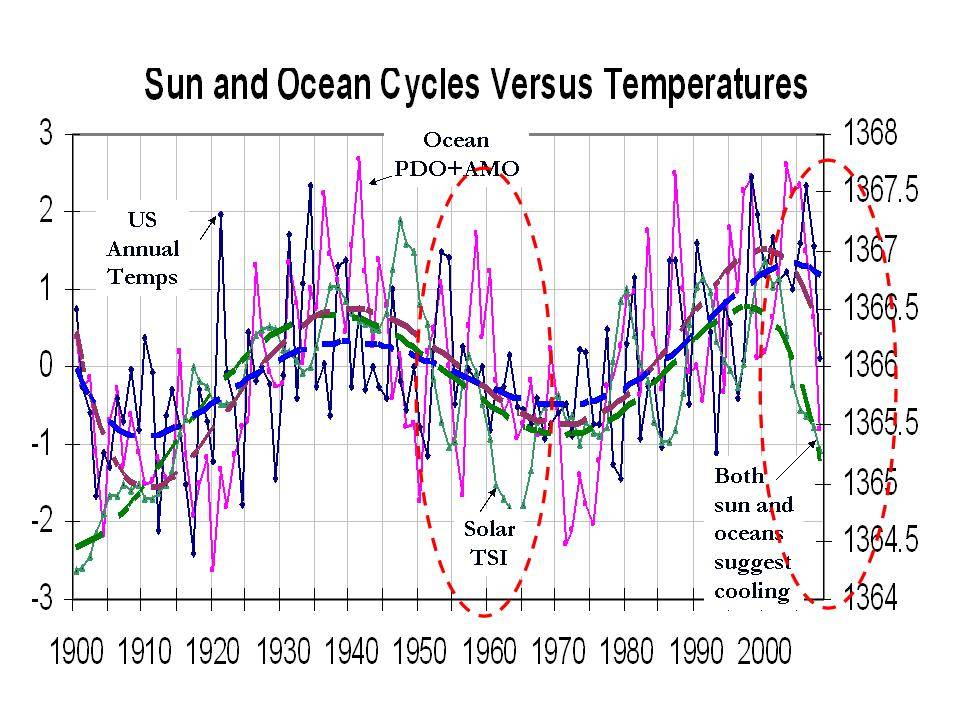
My prediction, substantiated in my AMO post, calls for a continuation of an essentially flat temperature trend through 2018 followed by about 30 years of substantial global cooling (at which point the climate charlatans will -- once again -- tell us we will all freeze to death unless big government steps in to save us).

So, the next time a purely political propagandist tries to present you with an Oz-like climate magic show, pull back the curtain and take a look at the charlatan hiding behind the curtain of “true lies”.

Click here for some basic climate change science.
Click here to debunk the hysteria topic by topic.

Saturday, September 26, 2009

Chasing a More Accurate Global [Climate] Trend

NASA Goddard, whose climate research is led by nutty extremist James Hansen, provides the world with the pretense of credibility through the NASA name. But, their alarmist presentations rely entirely upon deeply flawed surface temperature measurement stations and completely ignore the far more reliable satellite data. Anybody wonder why?

Quoting Joseph D’Aleo, CCM, AMS Fellow
(I inserted the first link):
“The long term global temperature trends have been shown by numerous peer review papers to be exaggerated by 30%, 50% and in some cases much more by issues such as urbanization, land use changes, bad siting, bad instrumentation, and variable ocean measurement techniques that changed over time. NOAA made matters worse by removing the satellite ocean temperature measurement which provide more complete coverage and was not subject to the local issues except near the coastlines and islands. The result has been the absurd and bogus claims by NOAA and the alarmists that we are in the warmest decade in 100 or even a 1000 years or more. See this earlier story that summarizes the issues.”
Click the image & read the rest:
Click the image & read the rest
Click here to enlarge the above graph & view the source.

Even some self-described Liberals in the media are beginning to understand how laughably unreliable the “official” surface temperature measurements are. Thomas Fuller notes (I inserted the link):
“Anthony Watts of Watt's Up With That has surveyed 80% of the USHCN surface temperature measurement sites and found that only 11% of them meet siting specifications.”
Click here for a lengthy series of detailed posts on this topic from Anthony Watts.

Click here for more on the current cooling trend.
Click here for basic science on climate change.

Thursday, September 10, 2009

Warm Bias of about 30% in the IPCC Reported Surface Temperature Trends

Update: The evidence just keeps coming.

Quoting PhD Climatologist Dr. Roger Pielke Sr.:
“Our [peer reviewed] paper… has clearly documented an estimated warm bias of about 30% in the IPCC reported surface temperature trends. This bias also brings into question the claim that 11 of the 12 years in the period 1995 to 2006 were the warmest on record. Moreover, despite the claim in the IPCC (2007) report, the tropospheric and surface temperature trends have not NOT reconciled...

The lack of news coverage on this documented bias which has appeared in the peer reviewed literature on the Klotzbach et al (2009) paper is another clear example of the failure of most of the journalism community to cover news that conflicts with the IPCC (2007) perspective.”
The cited peer reviewed science is:
Klotzbach, P.J., R.A. Pielke Sr., R.A. Pielke Jr., J.R. Christy, and R.T. McNider, 2009: An alternative explanation for differential temperature trends at the surface and in the lower troposphere.

Click the image of Dr. Pielke
& read the rest:

Click the image of Dr. Pielke & read the rest
Click here to examine the abstract.

Dr. Roger Pielke Sr. is a Senior Research Scientist in CIRES and a Senior Research Associate at the University of Colorado-Boulder in the Department of Atmospheric and Oceanic Sciences (ATOC) at the University of Colorado in Boulder.

Dr. Pielke has published over 350 papers in peer-reviewed journals.

Click here to review some of those publications.

Click here to understand why the media have not covered this.
Click here for some basic science on climate change.

Hot Topics:

BEST Data - No Warming Over Last Decade
The AMO as a Driver of Climate Change
Fact check - The wealthy already pay more taxes
Rare Earth Elements Spell Doom for Green Fantasies
Wikipedia’s Climate Doctor
ClimateGate - The latest updates
Dr. Tim Ball on ClimateGate - The end of AGW hysteria?
ClimateGate: The Musical - Hide The Decline!
Lindzen and Choi SHATTER the IPCC Computer models!
It’s OFFICIAL! We HAVE elected our own Hugo Chavez!
Health Care “Reform”
Cap & Trade - It’s just a giant tax (on EVERYBODY)
The Radicals in the White House
ACORN - The truth
Transparency - Obama promised it. So, where is it?
The Cause of the Housing Debacle
Fiscal Responsibility - In Obama’s Fantasy World
Atlas Shrugged: From Fiction to Fact in 52 Years
Iraq War Media Deceptions 101 - Why the Iraq invasion was justified and necessary
Climate Change 101 - Learn what the SCIENCE says about the biggest hoax EVER!
Obama - on Climate Change
Obama’s Climate Czar - The most dangerous politician in the United States
Obama’s Climate Czar - Her Socialist revolution has begun
Compare the current recession to previous recessions
Obama - Historic & Catastrophic!
Is Obama a Socialist? You BETCHA!
Makers & Takers - Spread the wealth
Obama = International Crisis
The economic case against Obama
The comprehensive case against Obama
The deficit case against the Dems
A Liberal Supermajority? Watch Out!
Examine the series you should have read before voting!
Maggie’s Totalitarian Political Religion
“Kill him!” - Just another media lie?
Journalistic Integrity? - WHERE?
The post about the TED Spread
Save the nation from the Entitlement binge!
Market Reaction to $700 Billion Bailout Vote
Drill Here, Drill Now - Quantitative Facts
ANWR - Drill There, Drill Now
ANWR Matters - Here’s why
Coal Liquefaction (Liquid Fuels From Coal)
The Ethanol Debacle
Pickens Plan - Don’t Fall For it!
Energy Tomorrow Radio - GOOD Stuff!
Economic Forecast
Iraq
Obama
More…

Labels

Blog Archive