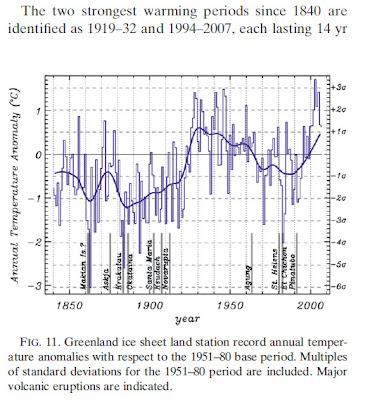
Case in point is this recent Reuters report:
“Climate-warming greenhouse gas emissions pushed Arctic temperatures in the last decade to the highest levels in at least 2,000 years, reversing a natural cooling trend that should have lasted four more millennia.”Here are three “inconvenient truths” from the Greenland Ice Sheet -- well within the Arctic Circle:
1) The same hysteria mongering headline could have been written in 1930!
show, circa 1930, generally warmer temperatures
AND a MUCH more rapid rise in temperature!
Click the image to enlarge it:

The above graph was copied from this paper.
Click here to examine the scientific journal which published that paper.
2) Although (questionable) surface station data show warmer temperatures than any known time in the last 2,000 years; one need ONLY go back another 17 years to find warmer temperatures than today! And, looking at the last 10,000 years, we find NOTHING even REMOTELY unusual about the latest warming!
we find there is NOTHING unusual about the latest warming!
AND, we find the 10,000 year cooling trend STILL intact!
Click the image to enlarge it:

Data Sources:
This file downloaded from this NOAA page.
This chart from this paper -- published in this journal.
3) Furthermore, contrary to the bald faced LIE in the Reuters quote:
show -- despite the recent warming -- a 2,000 year cooling trend
REMAINS INTACT!
Click the image to enlarge it:

Remember that the appended data in the shaded area are a
LINEAR representation of what is actually a pair of warming periods
more accurately depicted in the first graph in this post.
4 comments:
Your point 3 is, well, one statistical model of an infinite number of such models. The trend remains intact in your model but what can be said from the DATA is that the cooling is reversed so that we now have roughly the same temperatures as 2000 years ago. It is like when the media recently claimed that temperatures have not cooled recently. They have, obviously, as the temperatures now are lower than a few years ago. Fitting a model without proper validation is a mock argument.
I agree to the rest though, thanks.
avfuktning vind och krypgrund,
Swedish? Welcome!
I believe your point is that there are multiple ways to calculate a linear regression.
This is true. But, there is only one linear regression model built into Microsoft Excel and that is the method I used to demonstrate that -- despite the recent warming -- the 2,000 year cooling trend remains intact and unbroken (as does the 10,000 year cooling trend).
Yes, the Arctic does appear to be about the same temperature as it was 2,000 years ago. So what? The oft stated goal of the climate alarmists is that they want to stabilize the climate so that nothing changes. If that is the (unattainable) goal, then they should welcome a brief respite from a 10,000 year cooling trend.
Additionally, the 10,000 year chart allows us to put the recent warming into better context. In fairly short order, there will be another down spike on that chart to counterbalance the recent up spike -- and, the 10,000 year cooling trend will continue.
Hey, your graph on number 1 is a graph of a region of the earth (Greenland) http://polarmet.osu.edu/PolarMet/PMGFulldocs/box_yang_jc_2009.pdf and not global average temps. The two are not the same.
The largest and likely most accurate statistical analysis of global average temperatures was recently done through the BEST project http://berkeleyearth.org/analysis/ (even through funding from global warming skeptics), and its conclusions agree with the wikipedia chart here http://en.wikipedia.org/wiki/Global_warming and with what climate scientists continue to say.
You may want to do some re-evaluation, and thanks for posting my comment.
PS: I found this site though comments you left on Barry Bickmore's website. .. Again, thanks.
1) Christ! Which part of "Arctic" did you not understand? This post deals exclusively with "ARCTIC" temperatures (and, Greenland is inside the Arctic Circle) -- moron!
2) The BEST data project was headed up by an alarmist professor at Berkeley. Since you're fond of Bickmore's purely political propaganda, it's no surprise that you misunderstand what the BEST data (and all other datasets) demonstrate.
A) Click here and get schooled on the BEST data.
B) Click here and here to get schooled on the single biggest (and most profitable) fraud EVER perpetrated.
Post a Comment