Showing posts with label Climate Change - BEST Data. Show all posts

Wednesday, November 2, 2011

BEST critics & the phony media meme

Click here to examine criticisms of the BEST data (including the brazenly false (and typical) media meme that Berkeley physics professor Richard Muller was a CAGW skeptic turned true believer).

But, even if one accepts that the BEST data really are “best”, it’s dirt simple to demonstrate that -- if we simply select start and stop dates from similar points in the AMO cycle -- all we’re left with is the very steady, perfectly natural, multi-century underlying warming rate of 0.5C/century described by Akasofu, 2010 and summarized by Dr. David Evans (a true believer turned skeptic).

Click here for some basic climate change science.
Click here to debunk the hysteria topic by topic.

Monday, October 31, 2011

The AMO Driving BEST Climate Change

Updated on 10/31/11
Located & cited actual calculated OLS liner trends.
I had previously eyeballed it from the OLS charts.
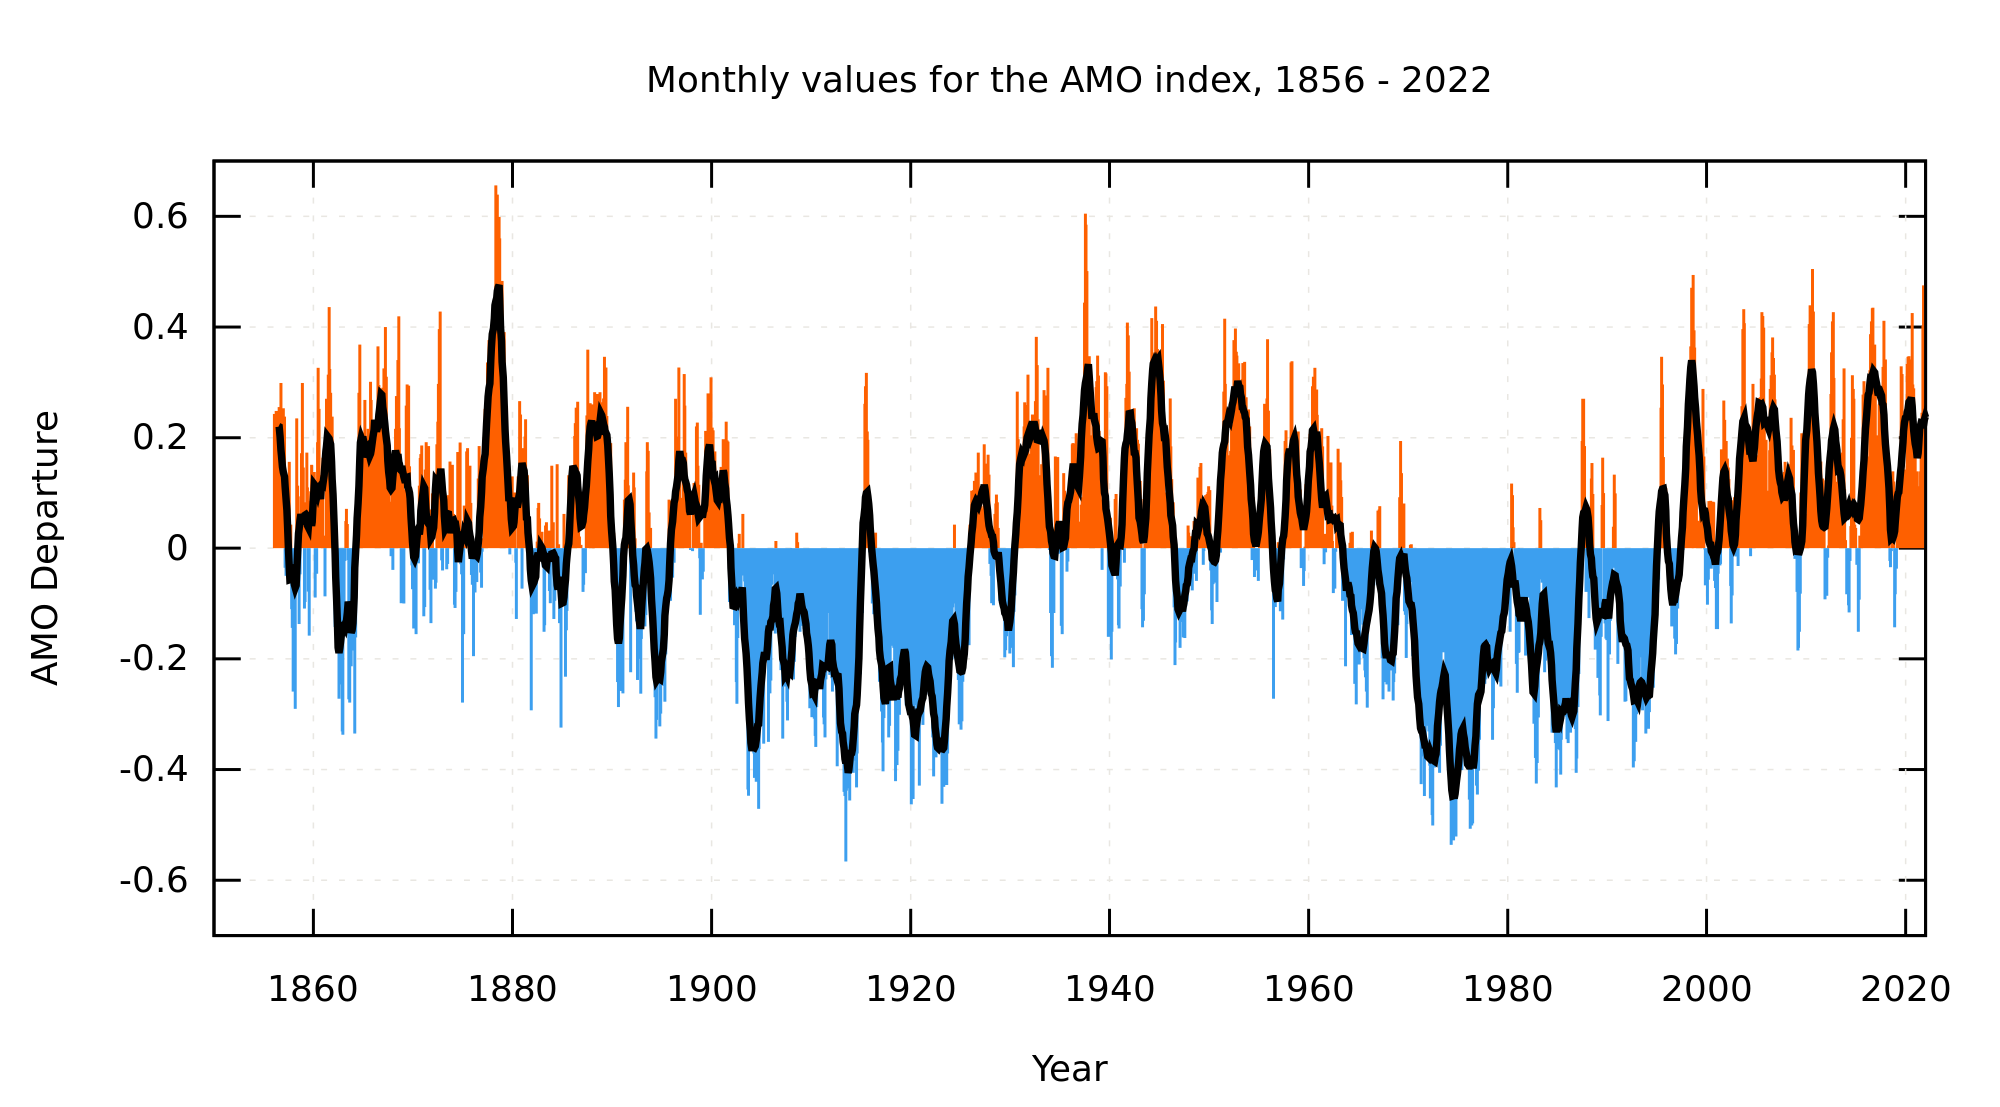
Changes were minuscule & conclusions unchanged.

This post documents that, once we correct for the Atlantic Multidecadal Oscillation, the newly released BEST data show an average global warming rate of 0.5C/100 years. This is identical to the multi-century NATURAL steady warming rate of “0.5°C/100 years” described by peer reviewed science (Akasofu, 2010).

The BEST data recently debuted with a firestorm soon erupting between the two co-authors of four BEST papers. In the preceding link it is suggested that the BEST data indicate “the planet has warmed by almost a degree centigrade since 1950”.

But, in the aforementioned firestorm, even Muller admits that:
“the BEST data suggested that world temperatures have not risen for about 13 years”
That observation leads Judith Curry to confirm she is accurately quoted to say:
“Whatever it is that’s going on here, it doesn’t look like it’s being dominated by CO2”
That caused me to ponder what the BEST data would show if we examined the exact same time frames I used in a previous analysis of the impact of the Atlantic Multidecadal Oscillation (aka AMO) on temperature trends in the USA. I did just that and arrived at the conclusion described in the first paragraph.

Here’s how I got there…

1950 to 2011
(The last data point available is 5/2010.)
The period accurately alleged to show a warming of 1C.
Click the image to enlarge it:
Click the image to enlarge it
Click here for the source.

But, what happens when our start & stop dates
are selected at similar points in the AMO cycle?


1913 to 1976
(The bottom of the two most recent AMO cooling cycles)
Click the image to enlarge it:
Click the image to enlarge it
Click here for the source.
Linear OLS trend = 0.0025558C/year (0.25558C/100 years).

1938 to 1998
(The peak of the two most recent AMO warming cycles)
Click the image to enlarge it:
Click the image to enlarge it
Click here for the source.
Linear OLS trend = 0.00745215C/year (0.745215C/100 years).

1925 to 1995
(The point where two AMO warming cycles cross the baseline)
Click the image to enlarge it:
Click the image to enlarge it
Click here for the source.
Linear OLS trend = 0.00508102C/year (0.508102C/100 years).

The average warming rate for these three samples is 0.5C/100 years. Again, this is identical to the multi-century NATURAL steady warming rate of “0.5°C/100 years” described by peer reviewed science (Akasofu, 2010).

Click here & see how the AMO killed the CAGW cult.
Click here for some basic climate change science.
Click here to debunk the hysteria topic by topic.

Sunday, October 30, 2011

BEST Data - No Warming Over Last Decade

Quoting David Rose
at The Mail on Sunday (emphasis mine):
“It was hailed as the scientific study that ended the global warming debate once and for all – the research that, in the words of its director, ‘proved you should not be a sceptic, at least not any longer’.

Professor Richard Muller, of Berkeley University in California, and his colleagues from the Berkeley Earth Surface Temperatures project team (BEST) claimed to have shown that the planet has warmed by almost a degree centigrade since 1950 and is warming continually…


[Click here for a paper demonstrating a warming rate of 0.7C per CENTURY from 1958 to 1998.

Click here to examine the NATURAL DRIVERS of that warming.

Click here & here to put that warming into proper perspective.]

Prof Judith Curry, who chairs the Department of Earth and Atmospheric Sciences at America’s prestigious Georgia Institute of Technology, said that Prof Muller’s claim that he has proven global warming sceptics wrong was also a ‘huge mistake’, with no scientific basis

In fact, Prof Curry said, the project’s research data show there has been no increase in world temperatures since the end of the Nineties – a fact confirmed by a new analysis that The Mail on Sunday has obtained.”
Click the image & read the rest:
Click the image & read the rest
Click here to enlarge the image.
Click here for the cited post at the Global Warming Policy Foundation.

Click here for commentary.
Click here for a critique of the BEST data processing algorithms.

Click here to examine a BEST rewriting of temperature history.
Do we have yet ANOTHER ClimateGate brewing here?

Click here for some basic climate change science.
Click here to debunk the hysteria topic by topic.
Hot Topics:

BEST Data - No Warming Over Last Decade
The AMO as a Driver of Climate Change
Fact check - The wealthy already pay more taxes
Rare Earth Elements Spell Doom for Green Fantasies
Wikipedia’s Climate Doctor
ClimateGate - The latest updates
Dr. Tim Ball on ClimateGate - The end of AGW hysteria?
ClimateGate: The Musical - Hide The Decline!
Lindzen and Choi SHATTER the IPCC Computer models!
It’s OFFICIAL! We HAVE elected our own Hugo Chavez!
Health Care “Reform”
Cap & Trade - It’s just a giant tax (on EVERYBODY)
The Radicals in the White House
ACORN - The truth
Transparency - Obama promised it. So, where is it?
The Cause of the Housing Debacle
Fiscal Responsibility - In Obama’s Fantasy World
Atlas Shrugged: From Fiction to Fact in 52 Years
Iraq War Media Deceptions 101 - Why the Iraq invasion was justified and necessary
Climate Change 101 - Learn what the SCIENCE says about the biggest hoax EVER!
Obama - on Climate Change
Obama’s Climate Czar - The most dangerous politician in the United States
Obama’s Climate Czar - Her Socialist revolution has begun
Compare the current recession to previous recessions
Obama - Historic & Catastrophic!
Is Obama a Socialist? You BETCHA!
Makers & Takers - Spread the wealth
Obama = International Crisis
The economic case against Obama
The comprehensive case against Obama
The deficit case against the Dems
A Liberal Supermajority? Watch Out!
Examine the series you should have read before voting!
Maggie’s Totalitarian Political Religion
“Kill him!” - Just another media lie?
Journalistic Integrity? - WHERE?
The post about the TED Spread
Save the nation from the Entitlement binge!
Market Reaction to $700 Billion Bailout Vote
Drill Here, Drill Now - Quantitative Facts
ANWR - Drill There, Drill Now
ANWR Matters - Here’s why
Coal Liquefaction (Liquid Fuels From Coal)
The Ethanol Debacle
Pickens Plan - Don’t Fall For it!
Energy Tomorrow Radio - GOOD Stuff!
Economic Forecast
Iraq
Obama
More…

Labels

Blog Archive