Located & cited actual calculated OLS liner trends.
I had previously eyeballed it from the OLS charts.
Changes were minuscule & conclusions unchanged.
This post documents that, once we correct for the Atlantic Multidecadal Oscillation, the newly released BEST data show an average global warming rate of 0.5C/100 years. This is identical to the multi-century NATURAL steady warming rate of “0.5°C/100 years” described by peer reviewed science (Akasofu, 2010).
The BEST data recently debuted with a firestorm soon erupting between the two co-authors of four BEST papers. In the preceding link it is suggested that the BEST data indicate “the planet has warmed by almost a degree centigrade since 1950”.
But, in the aforementioned firestorm, even Muller admits that:
“the BEST data suggested that world temperatures have not risen for about 13 years”That observation leads Judith Curry to confirm she is accurately quoted to say:
“Whatever it is that’s going on here, it doesn’t look like it’s being dominated by CO2”That caused me to ponder what the BEST data would show if we examined the exact same time frames I used in a previous analysis of the impact of the Atlantic Multidecadal Oscillation (aka AMO) on temperature trends in the USA. I did just that and arrived at the conclusion described in the first paragraph.
Here’s how I got there…
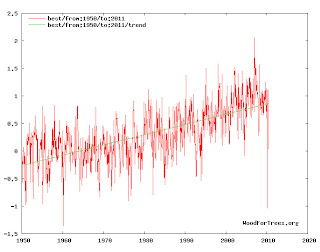
(The last data point available is 5/2010.)
The period accurately alleged to show a warming of 1C.
Click the image to enlarge it:

Click here for the source.
But, what happens when our start & stop dates
are selected at similar points in the AMO cycle?
1913 to 1976
(The bottom of the two most recent AMO cooling cycles)
Click the image to enlarge it:

Click here for the source.
Linear OLS trend = 0.0025558C/year (0.25558C/100 years).
1938 to 1998
(The peak of the two most recent AMO warming cycles)
Click the image to enlarge it:

Click here for the source.
Linear OLS trend = 0.00745215C/year (0.745215C/100 years).
1925 to 1995
(The point where two AMO warming cycles cross the baseline)
Click the image to enlarge it:

Click here for the source.
Linear OLS trend = 0.00508102C/year (0.508102C/100 years).
The average warming rate for these three samples is 0.5C/100 years. Again, this is identical to the multi-century NATURAL steady warming rate of “0.5°C/100 years” described by peer reviewed science (Akasofu, 2010).
Click here for some basic climate change science.
Click here to debunk the hysteria topic by topic.
1 comment:
And, the 0.5C per century of warming experienced since "The Little Ice Age" is explained by the "Vries solar cycle":
http://dailycaller.com/2013/12/05/report-scientists-predict-a-century-of-global-cooling/
Post a Comment