Updated on 10/22/11 at 10:29PM MST
Added a fourth chart.The following primarily deals with the impact of the
Atlantic Multidecadal Oscillation (aka AMO) on temperature trends in the USA.
Click here to examine the global impact.
Click here to examine the USA impact in more detail.
I have previously asserted that any honest analysis of temperature trends must begin and end at similar points in the AMO cycle. This is particularly true for USA temperature trends.
Global warming hysteria mongers frequently claim that the warming of the last 30 to 35 years was primarily caused by humans. But, when examining USA data, if one simply insists upon looking only at trends which begin and end at similar points in the AMO cycle, that much hyped warming (human induced or otherwise) virtually disappears.
The following charts show that -- from 1913, forward -- there is virtually no USA warming which cannot be explained by AMO warming cycles. So, if humans are warming the entire planet at a catastrophic rate, why -- once we correct for the AMO cycles -- is this not evident in the USA?
In the following three charts, I have selected beginning and ending dates based upon
a Wikipedia chart of the AMO index and (more precisely)
the raw data from NOAA from which that chart was derived.
Click here to reproduce each of the charts below.
1913 to 1976
(The bottom of the two most recent AMO cooling cycles)
Click the image to enlarge it:

The trend rate is 0.01F per decade
(0.1F per CENTURY).
1938 to 1998
(The peak of the two most recent AMO warming cycles)
Click the image to enlarge it:

The trend rate is 0.05F per decade
(0.5F per CENTURY)
0.5F per century is about HALF the:
“trend rate of 0.5°C per century since… the 1700s”
1925 to 1995
(The point where two AMO warming cycles cross the baseline)
Click the image to enlarge it:
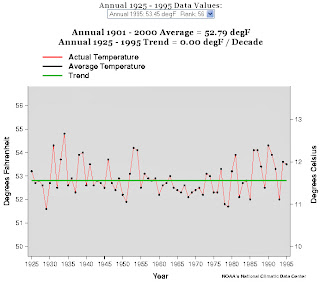
The trend rate is 0.00F per decade
(0.0F per CENTURY).
Not covered in the above 3 charts is 1998 to 2010.
The chart shows an AMO cooling phase for that period.
And, surprise, surprise -- so do USA temperatures.
Click the image to enlarge it:
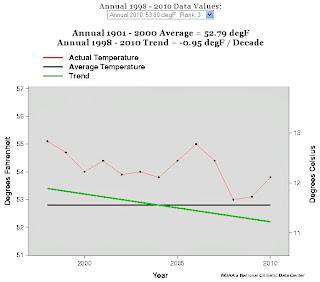
The trend rate is -0.95F per decade
(-9.5F per century).
Time for a global cooling panic? No!
Just a brief cooling phase -- nothing unusual
(just like the brief warming phase which preceded it).So…
The IPCC tells us that human activity has been the primary driver of temperature trends over the last century. But, the data make it perfectly clear that the AMO has been the primary driver of temperature trends over the last century -- especially in the USA. I submit to you that
the AMO will continue to be the primary driver of climate change over the next century as well.
Click here for some basic climate change science.
Click here to debunk the hysteria topic by topic.