Wednesday, June 11, 2008

Democrats vs. Obama


We Knew it Was Coming
Even Democrats Know Obama is Not Qualified


Hat tip to Tony Phyrillas


Monday, June 2, 2008

Drill Here, Drill Now, Pay Less

The Political Problem:
Energy Obstruction by Democrats
Click the Image to View The History

Click the Image to View The History
But, the above link covers only ANWR.
Click here for obstruction regarding drilling in The Outer Continental Shelf
Click here for obstruction regarding developing our tremendous Oil Shale resources.
President Bush long supported drilling in ANWR.
In 2008, President Bush strongly reiterated that position.
President Bush lifted the executive order banning drilling in the OCS.
The Department of the Interior’s Bureau of Land Management has drafted the
proposed Oil Shale regulations to ensure environmental protection.
Congressional Democrats are the ONLY remaining obstacle!


The Myth:
Dems Claim Oil “Speculators” Are The Problem
Click the Image to Dispel the Myth

Click the Image to Dispel the Myth


The REAL Problem is Supply & Demand
(Made Worse by “The Political Problem”):
In 2007, World Demand Exceeds World Supply
Click the Image to Enlarge it:

Click the Image to Enlarge it
I personally created and uploaded the above chart.
The data used in the above chart are found in this spreadsheet downloaded from this page.
Click here for more details on supply and demand issues.


The Result:
In 2007, Crude Oil Prices Begin to Soar
Click the Image to Enlarge it:

Click the Image to Enlarge it
I personally created and uploaded the above chart.
The data used in the above chart are found in this spreadsheet downloaded from this page.


The Result:
In 2007, Gasoline & Diesel Prices Begin to Soar
in Lock Step With Crude Prices
Click the Image to Enlarge it:

Click the Image to Enlarge it
I personally created and uploaded the above chart.
The data used in the above chart are found in this spreadsheet downloaded from this page.


The Wishful Thinking:
Domestic Conservation Will NOT Solve The Problem
The Growth in Demand is Not Under Our Control
Click the Image to Enlarge it:

Click the Image to Enlarge it
I personally created and uploaded the above chart.
The data used in the above chart are found in this spreadsheet downloaded from this page.
Click here to see where the demand is growing (and not growing).
Click here for the source of the previous link.


More Wishful Thinking:
Saudi Arabia Cannot Just Twist a Spigot and Produce More Crude
They Have Plenty of Oil
What They Lack is Production Capacity
We Can HELP!
Click The Image and Learn More:

Click The Image and Learn More


And Still More Wishful Thinking:
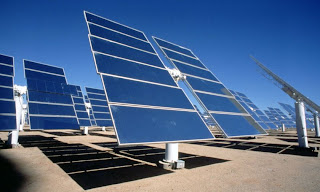
According to NPR, the best near term alternative to hydrocarbons is what Matthew Wald of The New York Times calls “Wishful Thinking”. We WILL transition to alternative energy, But it WILL take decades. In the interim, without more hydrocarbons, world economies will grind to a halt, venture capital will dry up and WE WILL NEVER GET THERE! The hydrocarbon economies create the capital which is necessary to invest into the development of future energy sources!

The Solution is NOT Found in Choosing Between Oil or Alternatives
The Solution is Oil AND Alternatives


Click the Image and Listen to The Audio Report From NPR:
Click the Image and Listen to The Audio Report From NPR


The Best Near Term Solution:
The Mean Estimates for ANWR and OCS Alone Place us
Ahead of Iraq in The Amount of Domestic Oil!
So, Open ANWR and The Outer Continental Shelf for Drilling
Click the Image to Enlarge it:

Click the Image to Enlarge it
I personally created and uploaded the above chart.
The data used in the above chart are found in:
1) Proven Reserves - This spreadsheet downloaded from this page
2) ANWR Mean Estimate - 10.4 Billion Barrels
3) OCS Mean Estimate- 86 Billion Barrels


ANWR Covers 19 Million acres
2,000 Acres is Proposed For Development
Thus, 1/100th of 1% of ANWR Would be Developed:
Click the Image to Enlarge it:

Click the image to view the source (and a larger image)


ANWR Drilling (on Frozen Tundra)
Will be More Eco-Friendly Than Ever
Click the Image And Learn More:

Click the Image And Learn More


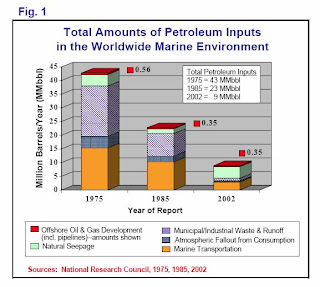
Worried About Offshore Oil Rig Spills? Don’t!
Click The Image and Learn The Quantitative Facts:
Click The Image and Learn The Quantitative Facts


Slightly Longer Term Solutions
That We Need to Start on NOW:
Oil Shale and Coal Liquefaction
Click the Image to Enlarge it:

Click the Image to Enlarge it
I personally created and uploaded the above chart.
The data used in the above chart are found in:
1) Proven Reserves - This spreadsheet downloaded from this page
2) ANWR Mean Estimate - 10.4 Billion Barrels
3) OCS Mean Estimate- 86 Billion Barrels
4) Bakken Formation - on average, 200 billion barrels Technically Recoverable
5) Oil Shale Mean Estimate - 800 Billion Barrels
6) Coal Liquefaction Mean Estimate - 535 Billion Barrels
Oil Shale technology was proven on a commercial scale at least as far back as 1924.
The largest Oil Shale facility has been in commercial operation since 1980.


Worried About Climate Change? Don’t!
Click The Image and Learn The Facts as Described by
Directly Cited Peer Reviewed Science, IPCC Scientists and More

 Click The Image and Learn The Facts as Described by Directly Cited Peer Reviewed Science, IPCC Scientists and More


Worried About Air Pollution? Don’t!
It is Well Controlled and Continuing to Drop:
Click the Image to Enlarge it
Click Here For the Entire Report

Click the Image to Enlarge it


Click here to learn more.


Wednesday, May 21, 2008

Taxes & Wages Under Republicans

Dims claim that Republicans have, in recent years, harmed the working person.

But, the objective, quantitative data tell another story (as usual):

1) The Truth About Tax Cuts.

2) The truth about inflation adjusted hourly compensation for working persons:


Inflation Adjusted Hourly Compensation (for the working person)
Click the image to enlarge & view the source data

Click the image to enlarge & view the source data

Continuously Compounded Annual Rate of Change
in Inflation Adjusted Hourly Compensation (for the working person)
Click the image to enlarge & view the source data

Click the image to enlarge & view the source data


Comparing pre-LBJ to post-LBJ, there was a slight slowdown in (continued positive) inflation adjusted wage growth from roughly 1975 to 1997. Blame the tidal wave of Federal Entitlements imposed by LBJ in the mid 1960’s, starting with Medicare and Medicaid.

But, trends have been improving since 1997 (after Republicans took control of Congress in 1996). Will the positive trends continue if Dims control both houses of Congress AND the White House. No, they won’t. But, the media will, as usual, lie and distort. And, the terminally gullible will, as usual, believe every word of it.

Friday, May 16, 2008

Insanity Defined

===========================================
5/19/2008 - Life is Better in the Red States
===========================================


Carpe Diem noted the current economic conditions in Texas.

Meantime, even the farthest of the Far Left states are already rebounding.


===========================================
5/16/2008 - Expanded to Include a Gas Tax Map
===========================================

It has been said that one definition of insanity is doing the same thing over and over again and expecting different results each time.

So-called “Liberals” do that all the time. They apply the same tired old Socialist theory, watch it fail, tweak it (or simply rename it), watch it fail again and repeat the cycle ad infinitum. After each failure, they swear the theory is good, only the implementation was bad and this time it’s going to work. But, it never does (and they never learn).

Fast forward to today and the two hot (and interrelated) topics on the campaign trail, the economy and the price of gasoline. So-called Liberals promise they will “fix” both issues. But, just one glance at the following four maps proves that anyone who believes that fits the aforementioned definition of insanity:

1) So-called Liberal voters are evident in this map of Presidential election results for 2004. Darker red denotes stronger support for Bush. Darker blue denotes stronger support for Kerry (click the image to enlarge, click here for the source image):


I use the above image merely as an indication of the national voting habits which generally translate to the state level voting habits (and the ensuing harmful state legislation).

2) The following map documents the cents per gallon in taxes paid for a gallon of gasoline in each state (blue is lower & red is higher). Note that, as is described here, there are other legislative factors which come to bear beyond direct taxation at the pump. Click the image to enlarge, click here for the source image:


3) The following map documents the price of gasoline as of 5/10/2008. Darker red denotes higher gas prices (click the image to enlarge, click here for the most recent data):


4) The following map documents the unemployment data as of March, 2008. Darker blue denotes higher unemployment (click the image to enlarge, click here for the most recent data):


Does anybody notice a general pattern among these four maps? It’s not exact, but it’s pretty darn close.

And yet, tens of millions of so-called Liberals will, in 2008, vote for more of the same that got them where they are. And they will have absolute conviction that doing so will reverse the trends that got them where they are.

Yep, that’s insanity all right!

If it Feels Good, Do it

The Woodstock generation proclaimed:
“If it Feels Good, Do it”:


Some of that generation were fortunate enough to outgrow that hedonistic, self-absorbed, self-destructive “philosophy”. Others used it as the foundation of their political ideology well beyond the point where their ponytails turned gray.

Thomas Sowell, in a three part series, has now laid bare, for all to see, exactly why so-called “Liberals” repeatedly exercise their precious liberties in such a self-destructive manner:

1) Too "Complex"?

2) Too "Complex"?: Part II

3) Too "Complex"?: Part III

Basically, so-called “Liberals” never outgrew the “philosophy” of their Woodstock days. Worse still, all too many went on to become university professors indoctrinating the next generation in their self-destructive “philosophy”.

Wednesday, May 14, 2008

Who Stole The American Spirit?

Folks, this is what happens when naïve individuals fall for the hysteria peddled by so-called “journalists” (and worse) who are either too ignorant to know better, are just following the herd or are looking to hand the White House to a Democrat (or, more likely, all of the above).

Quoting this excellent commentary:

“[T]here is something both startling and disturbing about the gloom that has settled over Wall Street and the country in general. In fact, looking back over the past century, it would be a stretch to rank the current problems as especially notable or dramatic. Something else is going on – namely a cultural rut of pessimism that is draining our collective energy, blinding us to possibilities, and eroding our position in the world.”

There are extremely relevant, objective and quantitative perspectives offered in that commentary which makes it well worth the short read.

Here are some additional perspectives:

1) In the prelude to the 2001 recession, the NASDAQ lost almost 70% of its value in less than 13 months.

And yet, as I documented here, the 2001 recession was the second shortest recession since World War II and arguably the least severe recession since World War II.

When somebody can document that, nationwide, the median home value declined by almost 70%, I will begin to think that we might be in for a really mild recession. Until then, it’s all just a bunch of hysteria pimping from so-called “journalists”.

2) With a giant hat tip to an excellent blog (Carpe Diem), click each of the images below to read the associated blog post:

Gas At Historical Highs? Not Even Close When Considering Income is Also at Historical Highs
Click the image to read the associated blog post
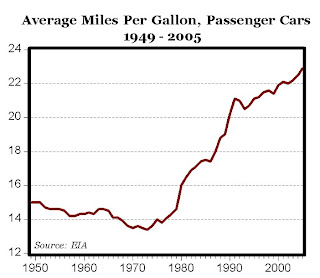


Gas At $3.56 Per Gallon Is A Bargain, Adjusting for The 71% Increase in Fuel Efficiency Since 1973
Click the image to read the associated blog post


And You Thought Gasoline Prices Were High? The U.S. Postal Monopoly Has Its Privileges
Click the image to read the associated blog post


And, there’s a great deal more fine perspective on the current state of our economy at Carpe Diem.

Monday, May 5, 2008

Climate Change Videos

Each of the next four videos features IPCC scientists who question the extent of Man Made Global Warming and whether Man Made Global Warming represents a climate crisis or even anything we should be remotely concerned about.

Video
Stossel vs. An Inconvenient Truth
:
(Note how children are abused by Environmental Extremist scare tactics)


Video
Government Policy -
FAR More Dangerous Than Climate Change:


Video
The Great Global Warming Swindle:


Video
Climate of Fear:


Video
Air Con - Part I:


Video
Weather Channel Founder and Meteorologist John Coleman:


And, more observations from John Coleman.

After reviewing all of this (or not), review a six step template for advancing any Environmental Extremist nonsense you like.

Now, witness how easy it is to use even one or two portions of that template to get recruits signed onto your new cause (no matter how crazy):


Video
Environmental Activists Sign a Petition to Ban Water:


Oh heck, while we’re at it, let’s take a look at eco-Imperialism. It’s all interrelated.

Return to Climate Change 101

Hot Topics:

BEST Data - No Warming Over Last Decade
The AMO as a Driver of Climate Change
Fact check - The wealthy already pay more taxes
Rare Earth Elements Spell Doom for Green Fantasies
Wikipedia’s Climate Doctor
ClimateGate - The latest updates
Dr. Tim Ball on ClimateGate - The end of AGW hysteria?
ClimateGate: The Musical - Hide The Decline!
Lindzen and Choi SHATTER the IPCC Computer models!
It’s OFFICIAL! We HAVE elected our own Hugo Chavez!
Health Care “Reform”
Cap & Trade - It’s just a giant tax (on EVERYBODY)
The Radicals in the White House
ACORN - The truth
Transparency - Obama promised it. So, where is it?
The Cause of the Housing Debacle
Fiscal Responsibility - In Obama’s Fantasy World
Atlas Shrugged: From Fiction to Fact in 52 Years
Iraq War Media Deceptions 101 - Why the Iraq invasion was justified and necessary
Climate Change 101 - Learn what the SCIENCE says about the biggest hoax EVER!
Obama - on Climate Change
Obama’s Climate Czar - The most dangerous politician in the United States
Obama’s Climate Czar - Her Socialist revolution has begun
Compare the current recession to previous recessions
Obama - Historic & Catastrophic!
Is Obama a Socialist? You BETCHA!
Makers & Takers - Spread the wealth
Obama = International Crisis
The economic case against Obama
The comprehensive case against Obama
The deficit case against the Dems
A Liberal Supermajority? Watch Out!
Examine the series you should have read before voting!
Maggie’s Totalitarian Political Religion
“Kill him!” - Just another media lie?
Journalistic Integrity? - WHERE?
The post about the TED Spread
Save the nation from the Entitlement binge!
Market Reaction to $700 Billion Bailout Vote
Drill Here, Drill Now - Quantitative Facts
ANWR - Drill There, Drill Now
ANWR Matters - Here’s why
Coal Liquefaction (Liquid Fuels From Coal)
The Ethanol Debacle
Pickens Plan - Don’t Fall For it!
Energy Tomorrow Radio - GOOD Stuff!
Economic Forecast
Iraq
Obama
More…

Labels

Blog Archive