Sunday, July 13, 2008

Iraq War Media Deceptions 101

Let’s just barely skim the surface of the media deception regarding the war in Iraq:

1) Read the 2002 Congressional authorization to use force in Iraq (supported by 58% of Senate Democrats and 39% of House Democrats).

2) Iraq had WMD stockpiles and the United Nations knew it!

If Saddam had no stockpiles of WMD, how do you explain 16 UN Security Council Resolutions over a period of 12 years, 14 of which deal directly with WMD?

Pay special attention to UNSCR 1441, which essentially said to Saddam (paraphrasing):
“Better hide the WMD, The United States will be invading 30 days from today”
But, that notice was given on 11/8/02 and we did not invade until 3/20/03. No wonder we have not found most of the WMD which the United Nations KNEW was there!

Even so, ISG, post war, REPORTED they found limited quantities of WMD. ISG also found clear evidence of intent to produce more WMD, including thermonuclear weapons. They failed to find clear evidence of large quantities of recently manufactured WMD. But, they were also:
“unable to rule out the possibility that WMD was evacuated to Syria before the war.”
Various other sources offer evidence that the WMD was evacuated to Syria.

Given fighter jets were buried in the desert, there clearly exists the possibility that WMD was buried in the desert.

3) 550 metric tons of yellowcake

The Iraq Survey Group devoted an entire section of their report to a “Survey of Structures at Tuwaitha Nuclear Research Center”. In that section, they reported that (emphasis mine):
“Certain structures pose hazards from a radiological and unexploded ordnance point of view. These structures were not entered, and the precise hazards were not determined”
During the first week of July, 2008 we finally learned that 550 metric tons of yellowcake had been secreted from Baghdad to Canada.

Was that huge stockpile sitting in one or more of those structures which “were not entered”?

Combine the above report with this quote from the (ISG) Duelfer Report:
“Senior Iraqis—several of them from the Regime’s inner circle—told ISG they assumed Saddam would restart a nuclear program once UN sanctions ended”

4) Saddam trained al Qaeda in the use of chemical and biological WMD.

Quoting an excerpt from the July, 2004 report from Bipartisan Senate Select Committee on Intelligence:
"The Central Intelligence Agency reasonably and objectively assessed in Iraqi Support for Terrorism that the most problematic area of contact between Iraq and al-Qaida were the reports of training in the use of non-conventional weapons, specifically, chemical and biological weapons"
Chapter XII, Page 346, Conclusion 94

In other words, Saddam trained al Qaeda in the use of biological and chemical WMD.

Every Democrat on that committee signed off on that finding.

5) Bin Laden was offered “a safe haven in Iraq” (and even Bill Clinton knew it).

Quoting The Bi-Partisan 9/11 Report:
“Iraqi officials offered Bin Ladin a safe haven in Iraq”
Page 66
“Saddam Hussein wanted bin Laden in Baghdad”
Page 134
In other words Saddam wanted to give al Qaeda precisely the same state sponsorship that led to 9/11.

A more comprehensive analysis of just how badly the world was misled by the so-called “journalists” who “reported” on the findings of the 9/11 commission can be found here. Each quote can be verified here.

Note: If any given quote spans 2 or more lines, the Adobe Acrobat “find” feature will not find it. If you fail to locate any given quote, select various smaller subsets of the quote until you find it (and you will).

6) Whether he trained the 9/11 terrorists or not, Saddam clearly trained terrorists at Salman Pak.

Quoting PBS in conjunction with The New York Times:
“I assure you, this operation [9/11] was conducted by people who were trained by Saddam [at Salman Pak].”
The above assertion may or may not be true. Contrary to what so-called “journalists” would tell you, it has not been proven either way. But, no reasonable person, Charles Duelfer included, denies that Saddam trained LOTS of terrorists at Salman Pak.

Click here for more on Saddam’s terrorist training camps.

Click here to explore the Saddam - al Qaeda link in FAR more detail.

7) Now, put 1, 2, 3, 4, 5 and 6 together and tell me what you get.

What you get is a WMD 9/11, quite probably a thermonuclear 9/11! But, I guess our so-called “journalists” forgot to tell you that!

Click here to learn more

Thursday, July 10, 2008

The Truth About Tax Cuts

Updated 9/7/2010


A few facts about lower marginal tax rates which Dems would prefer you not know (click each image to learn more):

1) Lower marginal tax rates have not produced lower revenues.

In fact, dropping the marginal tax rate, by virtue of The Laffer Curve, slightly increased real tax revenues (meaning tax revenues as a percentage of GDP):

Click the image to learn more

2) Those who make the highest incomes (I’m not one) have continued to pay the vast majority of the taxes (even more so than before):

Click the image to enlarge
I personally created and uploaded the above chart.
The data used in the above chart are found in this spreadsheet downloaded from this page

Click the image to view the source

Click the image to view the source

3) In fact:

“The top 1 percent of income earners paid 40 percent of all federal income taxes in 2007, while the bottom 50 percent paid only 3 percent.”

Click the image to learn more

4) And best of all:

As the marginal tax rate has gone down, recessions have been shorter & less severe, expansions have been longer & better and the unemployment rate has steadily declined (providing the greatest benefit to the lowest income earners).

Click the image to enlarge it and view the source:
Click the image to enlarge it and view the source data

Note: In the above chart, the extended expansion and the associated decline in unemployment during the sixties was a function of JFK lowering the marginal tax rate from 91% to 70%.

Unfortunately, subsequent to JFK, LBJ burdened the economy with new taxes for Medicare and Medicaid, Nixon implemented idiotic wage and price controls, Ford didn’t do much of anything and Jimmy Carter did just about everything wrong. It was not until the Reagan years (and his dramatic tax cuts) that our economy rebounded from the compounded lunacy of LBJ, Nixon and Carter.

So, yes, despite what the propagandists in the media say, it is clearly in the best interest of all Americans that the Bush Tax Cuts be made permanent.

Tuesday, July 8, 2008

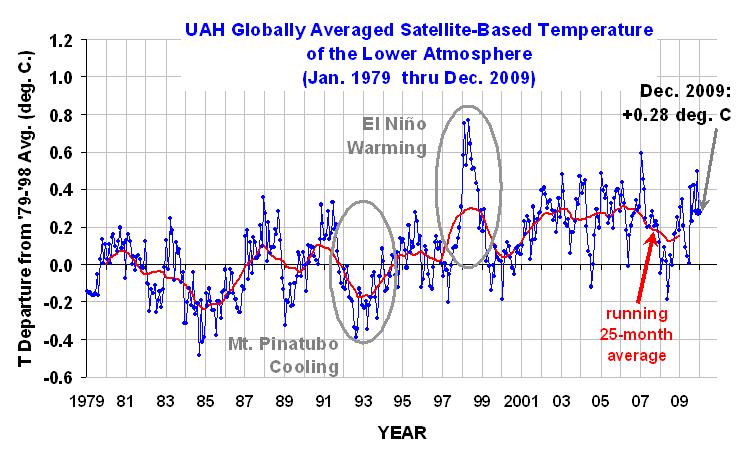
The Current Cooling Trend

Updated on 3/17/10 to include winter 2010 data.

Each of the following charts can be replicated by visiting this NOAA page and selecting the corresponding time frame and “Period” (either “Winter” or “Annual”).

Climate alarmist James Hansen & his Goddard Groupies have long argued that - according to their computer models - Man Made Global Warming is, by far, most evident in northern hemisphere winter warming. So, why has the United States been in a dramatic winter cooling trend ever since 1998?

Domestically, consistent with that 2001 paper, the period from 1962 to 2000
showed a winter warming trend of 0.96F per decade:
Click the image to enlarge

Of course, that 2001 paper made no mention of the
1954 to 1979 domestic winter cooling trend of -0.99F per decade:
Click the image to enlarge

Today, Hansen and the Goddard Groupies are even more loath to mention
the 1998 to 2010 domestic winter cooling trend of -3.15F per decade.
Click the image to enlarge it
Click the image to enlarge

In fact, despite all the alarmist propaganda,
there has been ZERO domestic winter warming in the last 23 years.
Click the image to enlarge it
Click the image to enlarge

For the annualized period 1998 to 2009,
the continental USA has been in a cooling trend of -1.03F per decade.
Click the image to enlarge it
Click the image to enlarge


Furthermore, directly quoting recent peer reviewed science:
“Our results suggest that global surface temperature may not increase over the next decade.”
My bet is we will see a continued and possibly accelerating cooling trend for considerably longer than “the next decade”.

Click the image for a global perspective:
Click the image for a global perspective

Click this image for another global perspective:
Click this image for another global perspective


According to Professor Bob Carter:
“In one of the more expensive ironies of history, the expenditure [of tax dollars] of more than $US50 billion ($60 billion) on research into global warming since 1990 has failed to demonstrate any human-caused climate trend, let alone a dangerous one.”
Okay, I’m not sure where Professor Carter got that “$US50 billion” figure. But, where else do you think all this research money comes from? ExxonMobil?

In the same essay, Professor Carter also notes:
“Not only do humans not dominate Earth's current temperature trend but the likelihood is that further large sums of public money are shortly going to be committed to, theoretically, combat warming when cooling is the more likely short-term climatic eventuality.”
Obviously, the data from NOAA back him up (even as the climate alarmists attempt, in vain, to tar and feather him).

There is, without doubt, a monetary incentive for climate scientists to come down on one side of the Climate Change debate. And, clearly, the overwhelming monetary incentive is to pimp for Man Made Global Warming.

Those scientists who dare to challenge the cultist orthodoxy with solid, peer reviewed scientific evidence are greeted, not with any financial incentive, but with fascist like attempts to silence all who dare to challenge the cultist orthodoxy:


Click here for more on the current cooling trend.
Return to Climate Change 101

Sunday, July 6, 2008

Salazar vs. Data

Updated 7/6/08


U.S. Representative John Salazar, (D-CO), is (correctly, or otherwise) quoted to say:

“Is the oil and gas industry manipulating prices? I would say so. My numbers show that production was at 80 percent during Memorial Day when it is usually around 96 percent this time of year”

The Data Say:
Refinery Capacity Utilization has been within a steady range since 1991
And, has not been at or below 80% since Hurricane Katrina Struck
Click the Image to Enlarge


I personally created and uploaded the above chart (and the next one).
The data used in both charts are found in this spreadsheet downloaded from this page.


Refinery Capacity Utilization is Slightly Lower Than Recent Years
(Note the impact of hurricane Katrina in September, 2005)
Click the Image to Enlarge


Click this link and learn why, thanks to Dems,
there is now less incentive to “crack” crude oil into gasoline.
Owing to the price of crude, many refineries are now operating at a LOSS!


Despite Lower Refinery Capacity Utilization,
US Gasoline Inventories in Q1 of 2008 Were Higher
Than at Anytime in the Last 5 Years
Click the Image to Enlarge


Source: Click here
The world demand for crude oil has, for some time, exceeded the world supply.
Prices will continue to rise until those two forces get back into balance.


Click the Image and Discover the REAL Problem:


Click here to learn more on the supply & demand issues.


World Oil Balance vs. Price

Updated 7/19/09
This post is a subset of a more comprehensive post
which quantifies why we should “Drill Here, Drill Now”.


For 4 out of 5 quarters (Q4 of 2006 - Q4 of 2007), global demand for crude oil exceeded global supply. In response, spot prices for crude oil rose steeply and rapidly.

In Q1 of 2008, global supply of crude oil significantly exceeded global demand. By Q3 of 2008, spot prices for crude oil began to drop. There appears to be a consistent 2 quarter lag time in the price response to the balance (or imbalance) between global demand and global supply.

The Balance Between World
Crude Oil Supply & Demand vs. Price
Click the image to enlarge it:

Click the image to enlarge it
I personally created and uploaded the above chart using these sources:
Global Supply and Demand - this spreadsheet downloaded from this page
(6/10/08 version through 6/11/09 version)
Spot price of oil - this spreadsheet downloaded from this page


Note: The supply/demand imbalance never exceeded 0.8 million barrels per day (about the amount ANWR alone could have been producing if ANWR had been approved decades ago). It is reasonable to say that ANWR alone could have entirely prevented the price spike we saw in the summer of 2008.

Note the short term and long term demand trends.
Click the image to enlarge it:

Click the image to enlarge it
Source: Click here

World Growth in Demand For Oil
(Updated on 7/19/09)
Click the image to enlarge it:

Click the image to enlarge it
Source: Click here

World Growth in Non-OPEC Supply of Oil
Note the “contribution” to supply growth from the United States
(Updated on 7/19/09)
Click the image to enlarge it:

Click the image to enlarge it
Source: Click here

Click here for a great deal more detail and professional analysis
(from the June 11, 2009 report).

Click here for the most current release of that report.

Thursday, July 3, 2008

Drill Here, Reduce The National Debt!

Please Click The Image
& Sign The Petition:


As reasonable people propose pragmatic solutions to rising gasoline prices, Democrats are being held hostage by Environmental Extremists.

The environmental realities (and far more) are addressed in this post.

Increased domestic drilling can produce large increases in revenues for our Federal Government. If our domestic multinational oil companies drill elsewhere, much of that tax money goes to other governments around the world.

In 2007 alone, Domestic “Big Oil” paid over
$11.4 BILLION in royalties to our government!
Click the Image to View The Numbers

Click the image to learn more
Drill Here, Drill Now, Pay WAY More Royalties!


In the first quarter of 2008 alone, three domestic “Big Oil”
companies alone paid over $47.8 BILLION in taxes both here and abroad!

Click the Chart to Enlarge
Click Here to View The Data Source

Additional substantiating data found here
(on the top of page 18)


Drill Here, Drill NOW, Pay WAY More Taxes to OUR government!


How much more money might OUR government receive by drilling here?
Well, examine the next chart and consider the potential.
The mean estimates for ANWR and OCS alone place us
ahead of Iraq in the amount of domestic oil!
So, Open ANWR and The Outer Continental Shelf for Drilling
Click the Image to Enlarge


I personally created and uploaded the above chart.
The data used in the above chart are found in:
1) Proven Reserves - This spreadsheet downloaded from this page
2) ANWR Mean Estimate - 10.4 Billion Barrels
3) OCS Mean Estimate- 86 Billion Barrels


Click here to learn more.


Gas Maps & Limo-Liberals

Compare This Map:
(Estimated monthly fuel costs
as a percentage of household income)


Click the map to enlarge.
Click here for explanation & source.


To This Map:
(Darker red denotes stronger support for Bush
& darker blue denotes stronger support for Kerry in the 2004 election)


Click the map to enlarge.
Click here for the source.


Anything jump out at you?
No wonder Limo-Liberals oppose
Drill Here & Drill Now”!

For those in the blue states who aren’t riding in Limos,
click here to see what Limo-Liberalism as done for you.


Hot Topics:

BEST Data - No Warming Over Last Decade
The AMO as a Driver of Climate Change
Fact check - The wealthy already pay more taxes
Rare Earth Elements Spell Doom for Green Fantasies
Wikipedia’s Climate Doctor
ClimateGate - The latest updates
Dr. Tim Ball on ClimateGate - The end of AGW hysteria?
ClimateGate: The Musical - Hide The Decline!
Lindzen and Choi SHATTER the IPCC Computer models!
It’s OFFICIAL! We HAVE elected our own Hugo Chavez!
Health Care “Reform”
Cap & Trade - It’s just a giant tax (on EVERYBODY)
The Radicals in the White House
ACORN - The truth
Transparency - Obama promised it. So, where is it?
The Cause of the Housing Debacle
Fiscal Responsibility - In Obama’s Fantasy World
Atlas Shrugged: From Fiction to Fact in 52 Years
Iraq War Media Deceptions 101 - Why the Iraq invasion was justified and necessary
Climate Change 101 - Learn what the SCIENCE says about the biggest hoax EVER!
Obama - on Climate Change
Obama’s Climate Czar - The most dangerous politician in the United States
Obama’s Climate Czar - Her Socialist revolution has begun
Compare the current recession to previous recessions
Obama - Historic & Catastrophic!
Is Obama a Socialist? You BETCHA!
Makers & Takers - Spread the wealth
Obama = International Crisis
The economic case against Obama
The comprehensive case against Obama
The deficit case against the Dems
A Liberal Supermajority? Watch Out!
Examine the series you should have read before voting!
Maggie’s Totalitarian Political Religion
“Kill him!” - Just another media lie?
Journalistic Integrity? - WHERE?
The post about the TED Spread
Save the nation from the Entitlement binge!
Market Reaction to $700 Billion Bailout Vote
Drill Here, Drill Now - Quantitative Facts
ANWR - Drill There, Drill Now
ANWR Matters - Here’s why
Coal Liquefaction (Liquid Fuels From Coal)
The Ethanol Debacle
Pickens Plan - Don’t Fall For it!
Energy Tomorrow Radio - GOOD Stuff!
Economic Forecast
Iraq
Obama
More…

Labels

Blog Archive