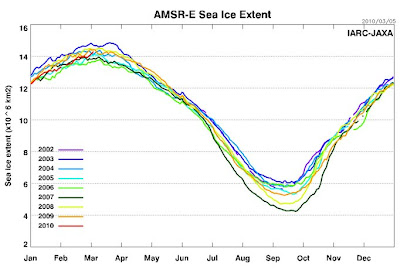
This chart demonstrates that 2009 and 2008 were a disappointment to the merchants of hysteria.
This post on Accuweather.com reflects what I view as the determination of the NSIDC to paint this year as being on a par with the recent minima of 2006-2007. Note - I believe Accuweather.com is about as free of bias as one can hope for -- all views are fairly presented.
As recently as 3/3/10 -- oblivious to an obvious divergence, apparent even in their own chart -- the alarmists at NSIDC were still asserting that:
“In February, Arctic sea ice extent continued to track below the average, and near the levels observed for February 2007.”However, year to date Arctic temperatures are currently trending lower than recent years. And this has probably been a contributing factor in a recent sharp rapid rise in the Arctic sea ice extent.
With a vast multitude of recent blows to the credibility of the church of man made global warming hysteria, I suspect the alarmists at NSIDC are desperate for a new record low (for the last few decades) in Arctic sea ice extent. But, if current trends hold, they might have set themselves up -- yet again -- for a hefty dose of egg on their faces.
Time will tell.
Meantime, examine the recent trends in Arctic temperatures and Arctic sea ice extent.
Click the image to enlarge it:

Click here for the source.
Arctic temperatures - 2009
Click the image to enlarge it:

Click here for the source.
Arctic Sea Ice Extent - Notice 2010 in red
Click the image to enlarge it:

Click here for the source.
Click here to debunk the Arctic sea ice hysteria mongering.
Click here for some basic climate change science.
2 comments:
Many AGW convinced people will only accept NSIDC figures... so here they are.
Febuary (month end averages) NSIDC (sea ice extent)
30 yrs ago
1981 Southern Hemisphere = 2.9 million sq km
1981 Northern Hemisphere = 15.7 million sq km
Total = 18.6 million sq km
Record Arctic minimum extent year (Sept 2007- 4.28 Mkm2).
2007 Southern Hemisphere = 2.9 million sq km
2007 Northern Hemisphere = 14.5 million sq km
Total = 17.4 million sq km
Last yr.
2009 Southern Hemisphere = 2.9 million sq km
2009 Northern Hemisphere = 14.8 million sq km
Total = 17.7 million sq km
This yr.
2010 Southern Hemisphere = 3.2 million sq km
2010 Northern Hemisphere = 14.6 million sq km
Total = 17.8 million sq km
Northern Hemisphere Plate
Southern Hemisphere Plate
1979-2000 Southern Hemisphere Feb. mean = 2.9 million sq km
1979-2000 Northern Hemisphere Feb. mean = 15.6 million sq km
Total Feb. mean = 18.5 million sq km
Note: updated graph shows ice has achieved nominal levels:
http://nsidc.org/data/seaice_index/images/daily_images/N_stddev_timeseries.png
Also note the Antarctic has reached summer minimum extent for the year, at 2.87 million square kilometers which is 88,500 square kilometers above the 1979 to 2000 average minimum.
http://nsidc.org/arcticseaicenews/
Keep fighting the good fight! GK
GK,
Thanks for the data and your kind words.
I'll see you back at Accuweather.
Post a Comment