Updated 10/24/2011 to include a quote from Dr. Richard Lindzen.
Quoting M.I.T. Climatologist Dr. Richard Lindzen
(Emphasis mine & I inserted the link):
“The motions of the massive oceans where heat is moved between deep layers and the surface provides variability on time scales from years to centuries. Recent work (Tsonis et al, 2007), suggests that this variability is enough to account for all climate change since the 19th Century.”
The Tsonis paper covers a wide range of ocean driven climate cycles. Included among the cycles is the
North Atlantic Oscillation. Not included is the
Atlantic Multidecadal Oscillation (the ocean cycle I explore below).
If one looked for a single factor explanation for the rise and fall of the
CAGW religious cult (and the Global Cooling cult which preceded it), the AMO (Atlantic Multidecadal Oscillation) would be a
very good candidate.
Click
here and
here for published science consistent with this view. Also consistent with this view is
this chart taken from
this published science (detailed in
a previous post).
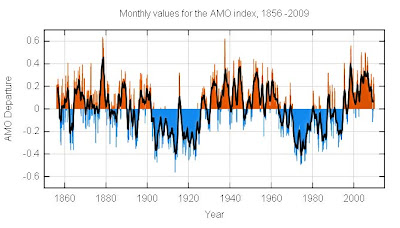
Examine the AMO chart of
rising and falling ocean temperatures.
Click the image to enlarge it:
 Click here for the source.
Ultimate data source is this file from this page.
In 1934, the continental USA experienced
the hottest year on record. That warm period closely correlated with an AMO warming cycle (see the graph above).
In 1975, the world was 30 years into a cooling trend closely correlated with AMO cooling. That was the year that
Newsweek swore we would all freeze to death unless big government came to our rescue.
In 1988, the world was one decade into a warming trend closely correlated with AMO warming. That was the year James Hansen
testified in front of Congress and started the CAGW hysteria cult.
By 1998, the AMO warming cycle peaked and plateaued. Coincidentally (or not),
the alarmists at NOAA admit there has been no global warming since 1998:
“The trend in the ENSO-related component for 1999–2008 is +0.08±0.07°C decade, fully accounting for the overall observed trend. The trend after removing ENSO (the "ENSO-adjusted" trend) is 0.00°±0.05°C decade.”
Peer reviewed science suggests that -- owing to the AMO -- there will be no global warming through 2018.
A simple examination of the chart above suggests that global temperatures will probably be generally flat through 2018 (at which point we’re likely to see another dramatic cooling trend such as the one which started around 1945 and, circa 1975,
caused alarmists to declare we were all going to freeze to death -- unless big government stepped in to save us).
The question is…
By 2040, will tomorrow’s climate charlatans try to convince us we will all freeze to death unless big government steps in to save us? Do you really need to ask?
Click the image & see how these AMO cycles
fit into a larger (and very gradual) warming trend:

This chart is copied from Akasofu, 2010.
The associated post was authored by Dr. David Evans.
Click here to further validate Akasofu’s conclusions.
Owing to
Milankovitch Cycles, the day
will come when
1,000 foot tall glaciers once again cover what is now New York City. But, mercifully, that day is probably
about 50,000 years away. In the meantime -- driven by various other
shorter term natural cycles -- temperatures will continue to rise and fall and the climate will continue to change (as it always has). But,
relatively speaking, we will continue to enjoy some of the most stable climatic conditions the world has ever known.
Click here for some basic climate change science.
Click here to debunk the hysteria topic by topic.


