Updated on 5/28/2012
Included RSS data showing 15+ years of global cooling.
Click here for a single factor explanation
of the rise and fall of Global Warming hysteria.
Click here to debunk the hysteria topic by topic.
Quoting H.L. Mencken
(I inserted the link):
“The urge to save humanity is always a false front for the urge to rule it.”
The following is a brief summary of the directly cited peer reviewed science which best refutes the hysteria surrounding Man Made Global Warming. Also included is the option to drill down deeper into the details and the citations.
Over geological time, we’re really in a CO2 famine now.
Click the chart to enlarge it:

Click here for details & to readily verify the data sources.
And, over geological time, there is NO
consistent correlation between CO2 and temperature:
Click here for details & to readily verify the data sources.
Click here for a likely explanation for the 4 “Ice Ages” in the above chart.
Click here for the associated peer reviewed abstract.
During the relatively brief period where we have seen a close correlation between temperature and CO2, every single ice core study
has demonstrated that temperature primarily drives CO2, not the other way around. Predictably, the IPCC has been
incredibly dishonest in dealing with that fact.
We also know that the temperature variations during glacial and interglacial cycles are primarily driven by three different orbital eccentricities collectively known as
Milankovitch Cycles.
Also important is the fact that each additional molecule of CO2 has exponentially less warming effect than the molecule which preceded it. This is best illustrated by
three different approximations of the total warming impact of CO2 from 0 ppm to 600 ppm.
Atmospheric CO2 is steadily increasing.
Click the chart to enlarge it:

Click here for the latest CO2 data.
And, yet, temperatures are obviously flat to down since at least 1998.
Click the chart to enlarge it:

Click here for the latest global temperature data.
Click here to further explore the current cooling trend.
Even the alarmists at NOAA
admit there has been no global warming since 1998:
“The trend in the ENSO-related component for 1999–2008 is +0.08±0.07°C decade, fully accounting for the overall observed trend. The trend after removing ENSO (the "ENSO-adjusted" trend) is 0.00°±0.05°C decade.”
NOAA further
admits that:
“The [computer model] simulations rule out (at the 95% level) zero trends [in global temperatures] for intervals of 15 yr or more, suggesting that an observed absence of warming of this duration is needed to create a discrepancy with the expected present-day warming rate.”
Dr. Phil Jones [of
ClimateGate infamy] has
now admitted that there has been no statistically significant global warming in the last 15 years.
Click here for a more technical description of this mathematical analysis from PhD physicist Dr. Luboš Motl.
The RSS Satellite data now show more than 15 years of global cooling!
Therefore, by NOAA’s own standards, the IPCC computer models -- the SOLE SOURCE of ALL climate change hysteria mongering -- have been officially invalidated!
Additionally,
peer reviewed science from May of 2008 suggests that:
“global surface temperature may not increase over the next decade”
It looks like we’re in for a NOAA/IPCC busting 25 years (or more) without any warming!
Click here to further challenge the IPCC computer models.
Vostok, Antarctica - an ongoing 10,000 year cooling trend.
The latest warming is not even remotely unusual.
Click the chart to enlarge it:

Click here for details & to readily verify the data sources.
Greenland ice sheet - an ongoing 10,000 year cooling trend.
The latest warming is not even remotely unusual.
Click the chart to enlarge it:

Click here for details & to readily verify the data sources.
Note: The most recent warming was NOT linear.
See the next chart.
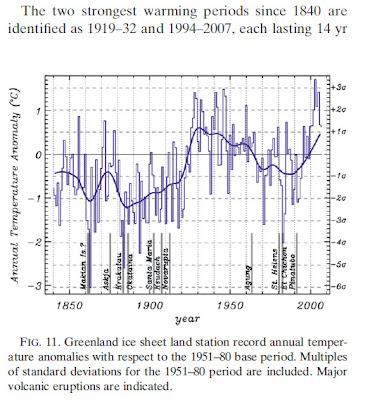
Greenland ice sheet -
Potentially warm biased temperature measurements
show, circa 1930, generally warmer temperatures
AND a MUCH more rapid rise in temperature!
Click the chart to enlarge it:

Click here for details & to readily verify the data source.
Vostok, Antarctica - the 140,000 year temperature history.
The latest warming is not even remotely unusual.
Click the chart to enlarge it:

Click here for details & to readily verify the data sources.
Vostok, Antarctica - the 423,000 year temperature history.
The latest warming is not even remotely unusual.
Click the chart to enlarge it:

Click here for details & to readily verify the data sources.
Click the image for more
basic science on climate change:


